Project Timeline
- The cost management dashboard offers a comprehensive overview of how financial resources are allocated and utilized within the project.
- Skystruct emphasizes real-time tracking of budgetary allocations, expenditures, and upcoming financial milestones, making the central area of focus on the dashboard dedicated to present-day costs, elapsed expenses, and upcoming financial events.
What is a Project Timeline?
A project timeline is a visual list of tasks or activities placed in chronological order,
which lets project managers view the entirety of the project plan in one place.
A project timeline typically takes the form of a horizontal bar chart, where each task is given a name
and a corresponding start and end date.
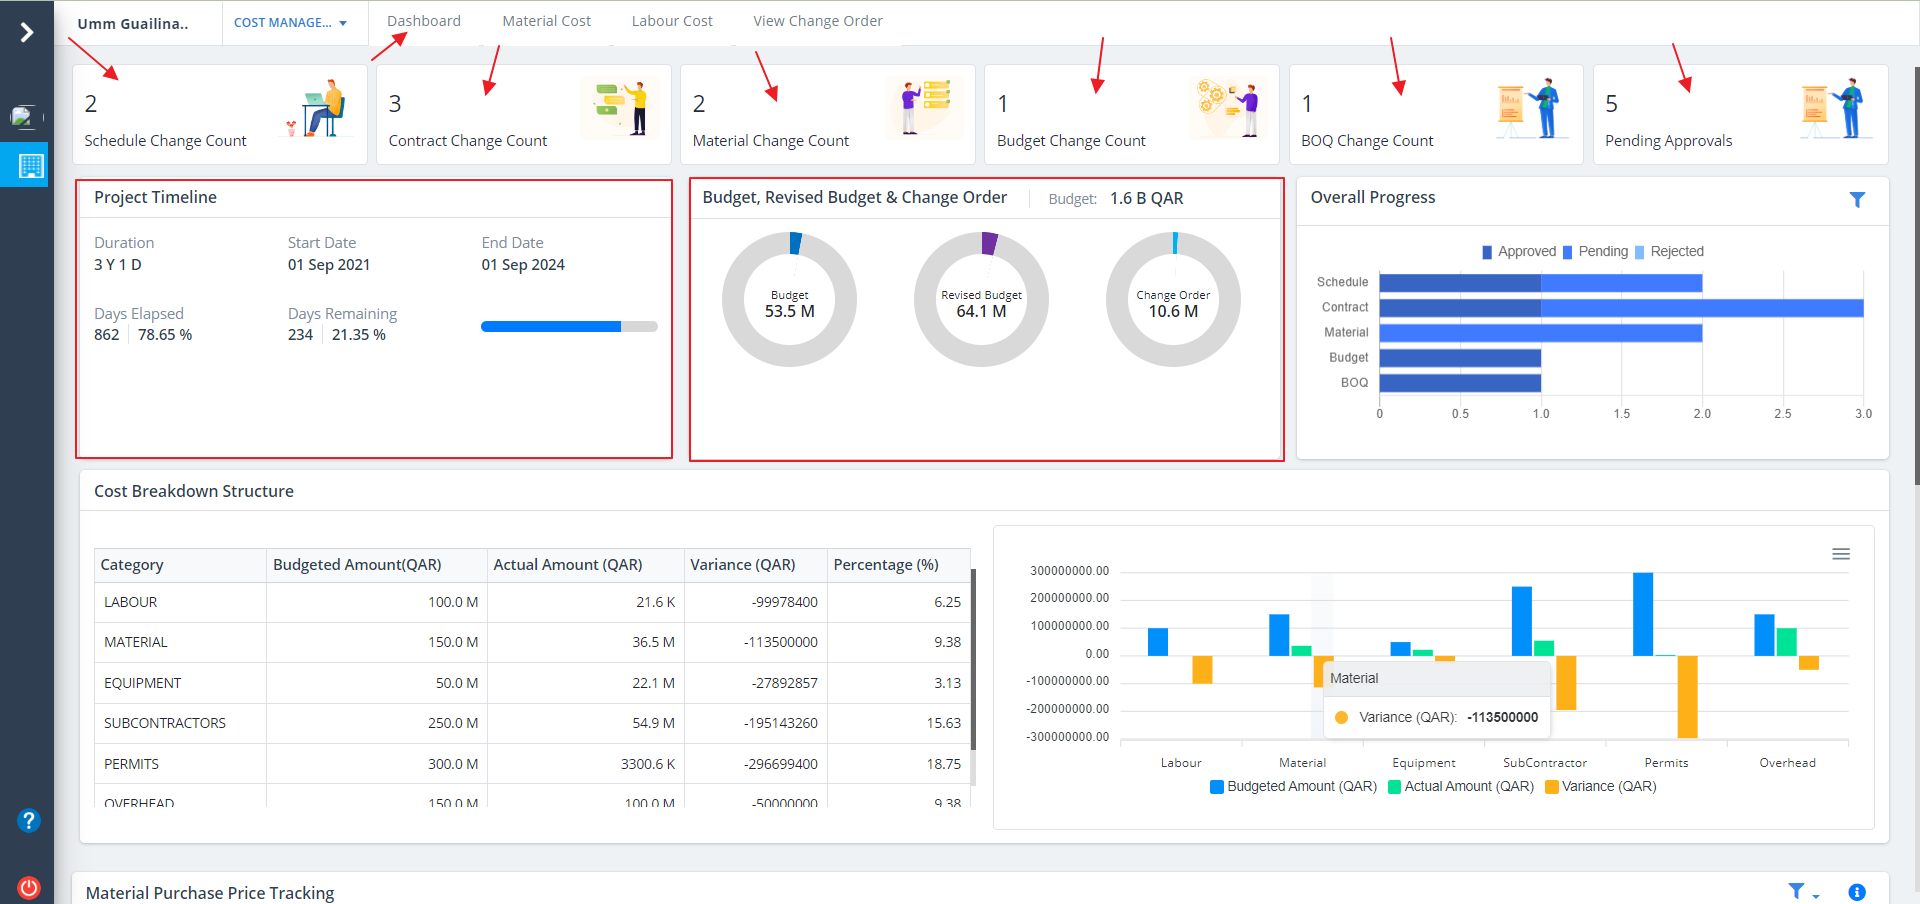
- Select Dashboard from menu.
- This covers a cluster of sections which includes schedule change count, contract change count, material change count, budget change count, BOQ Change Count and Pending Approvals.
Project Timeline details are as follows:-
- Project Timeline can be noted in a nutshell.
- Paramount details are shown.
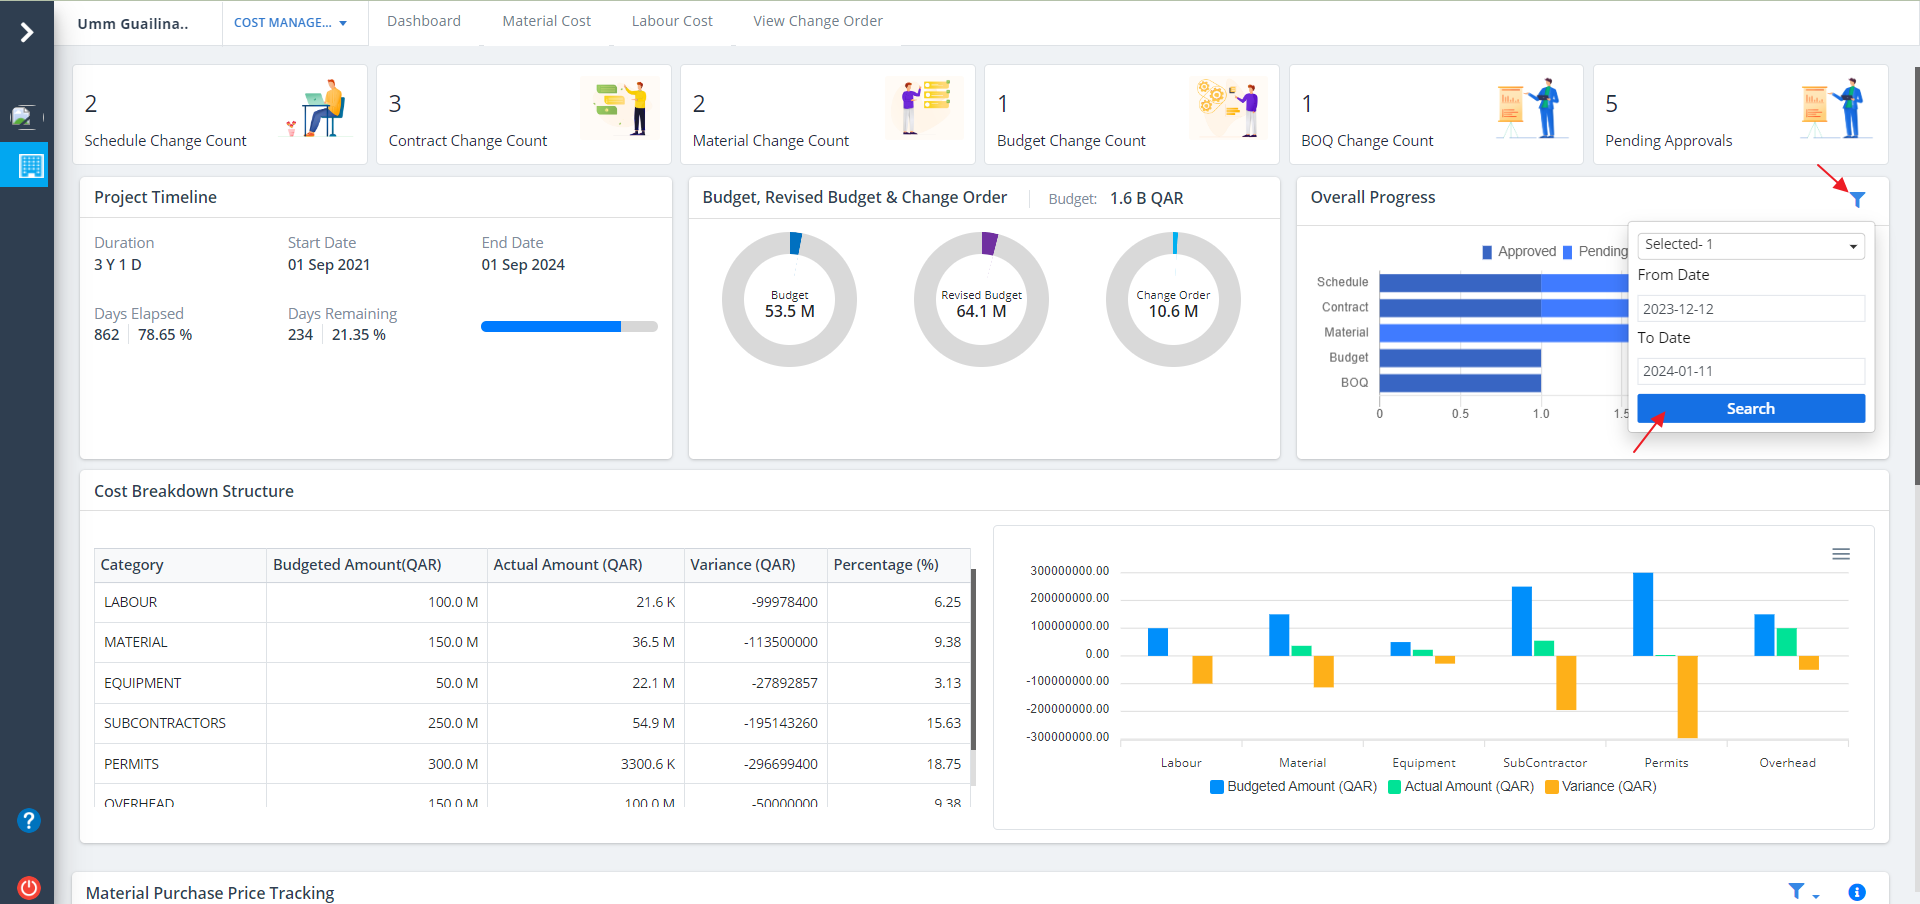
Project Progress
What is Project Progress?
Project Progress means a degree to which a project is developed and completed up to a moment -
a progress achieved up to certain moment means a condition and amount of work recently completed. It will show the progress of each and every required details.
Click on Filter as shown to narrow the bar graph visibility. Just click on Search after inputs are selected.
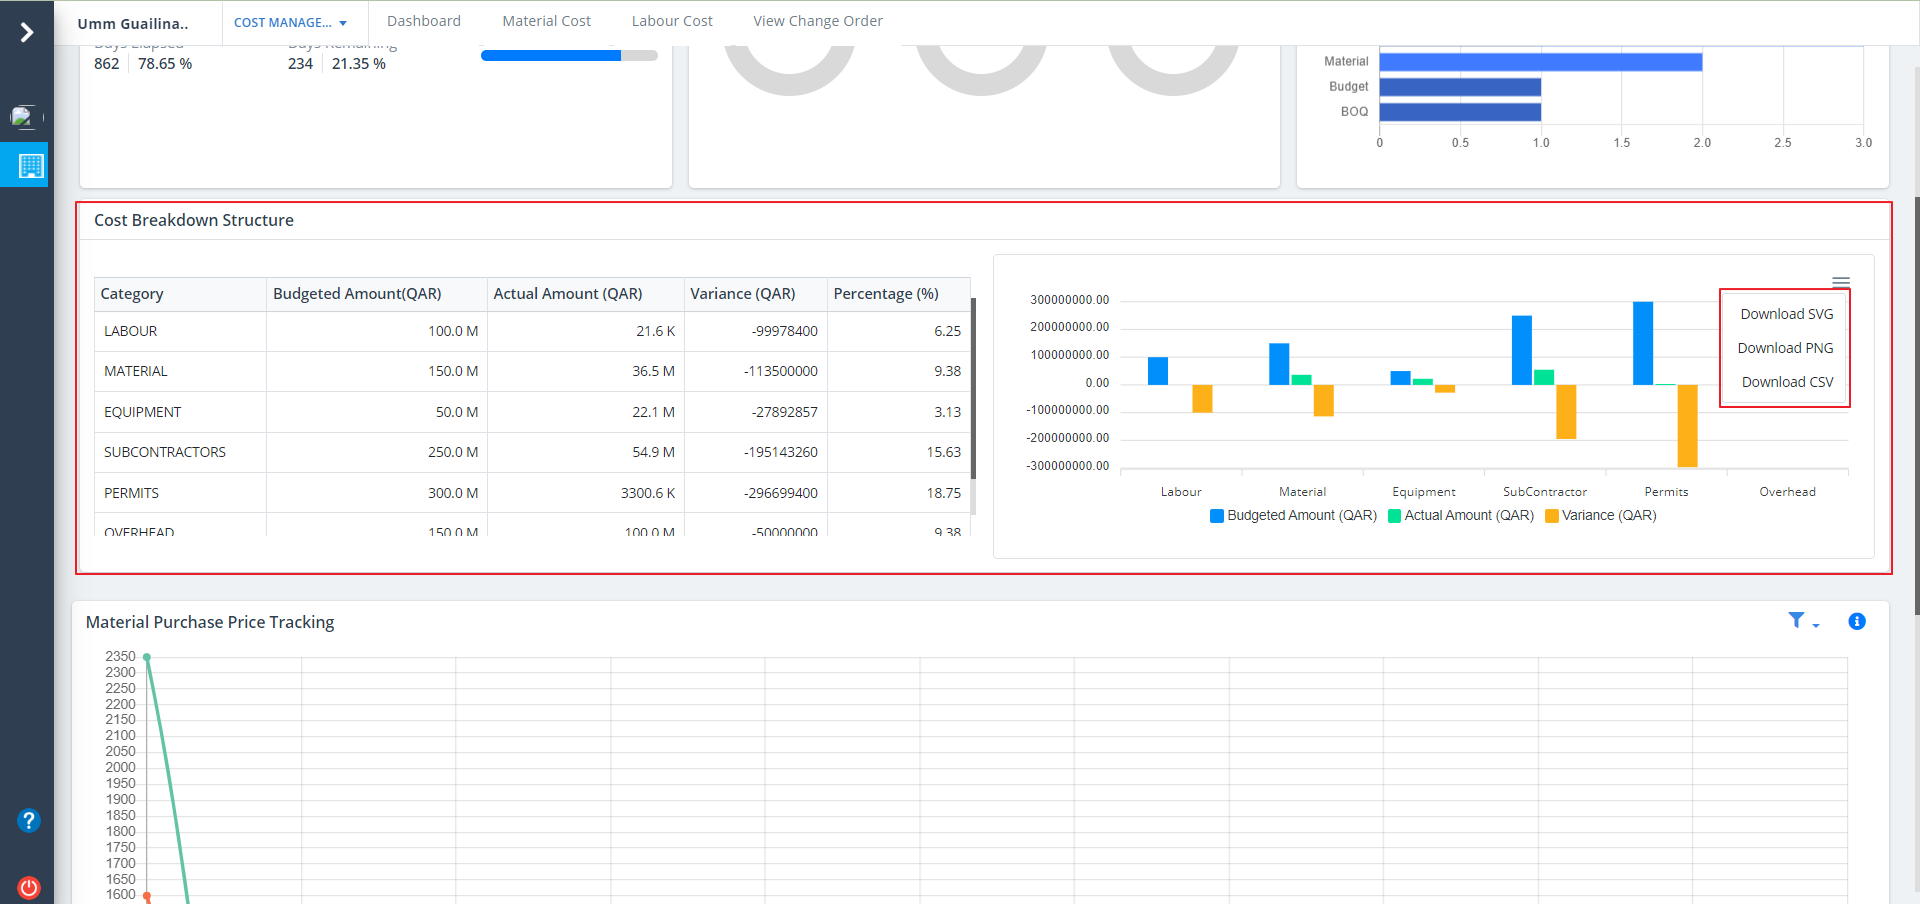
Cost Breakdown Structure
- This section covers a table and a graph for cost breakdown structure.
- There is a table on the left side which include the budget and the completion percentage.
- Section on the right side covers a cost breakdown bar graph which also covers the actual amount and budget.
- Click on the option as depicted to export svg, png and csv formats of the graph.
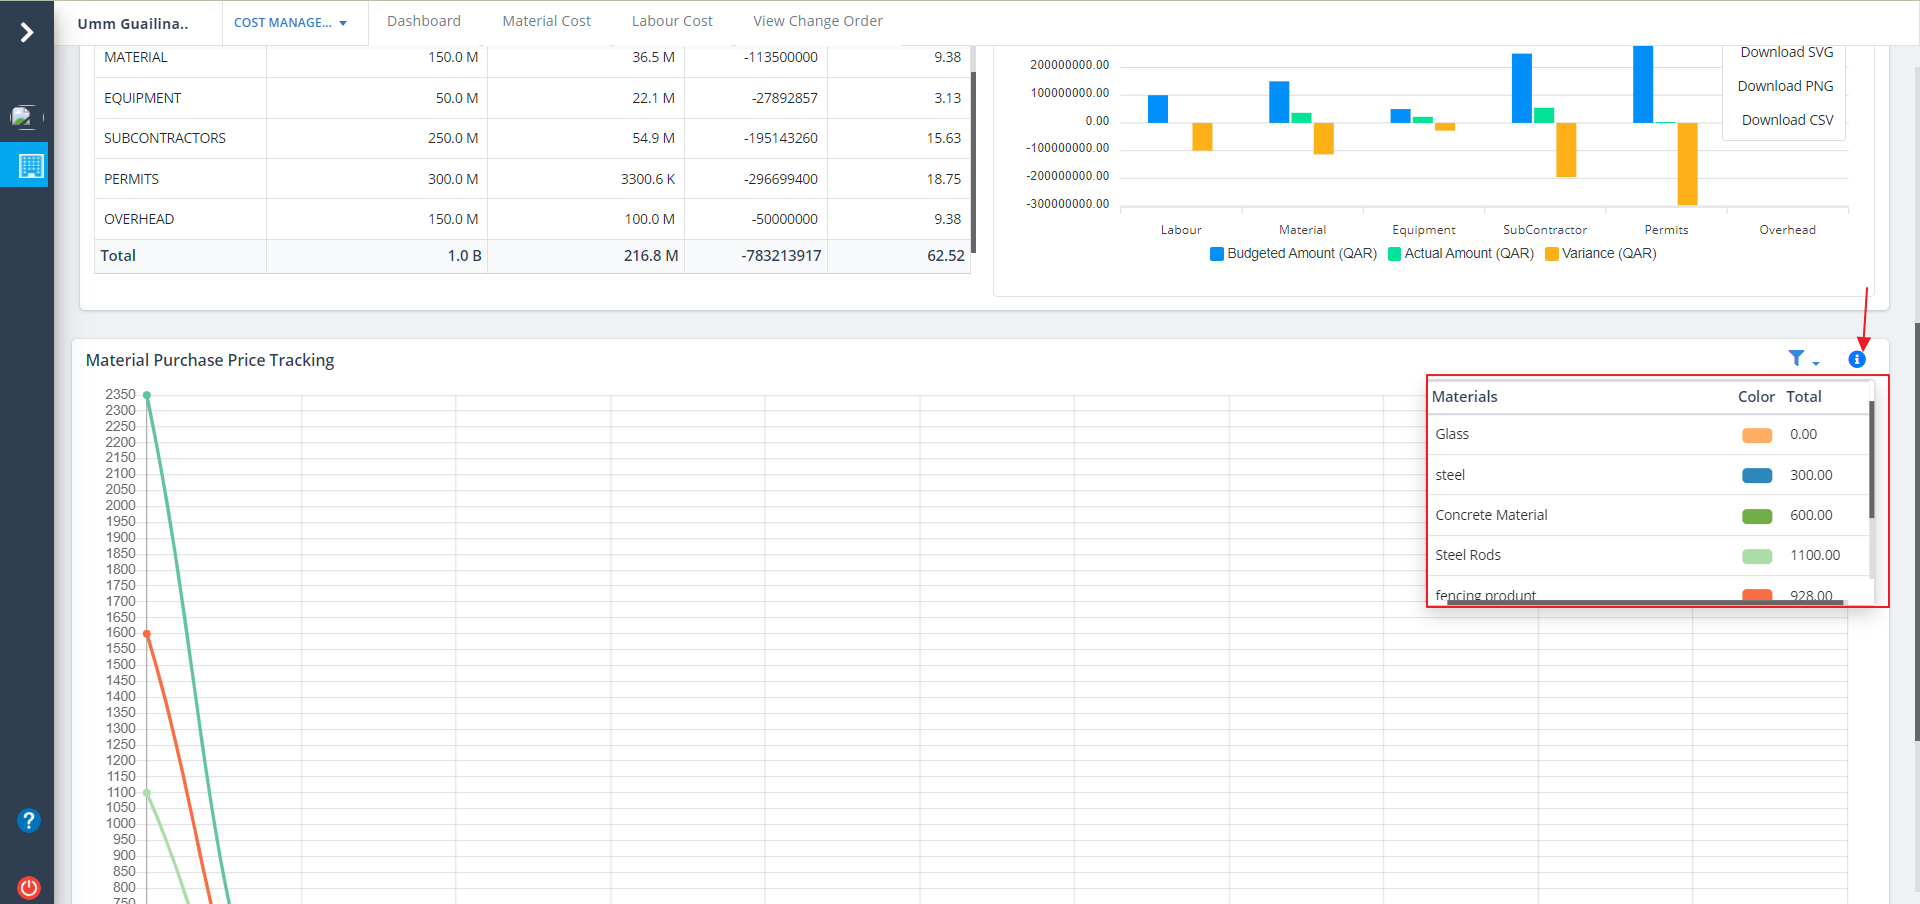
Material Puchase
- This section covers a graphical representation for material purchase.
- Line graph is shown which depicts the price range for the materials purchased.
- Click on the filter button to narrow the viewing. Click on Search button once inputs are selected.
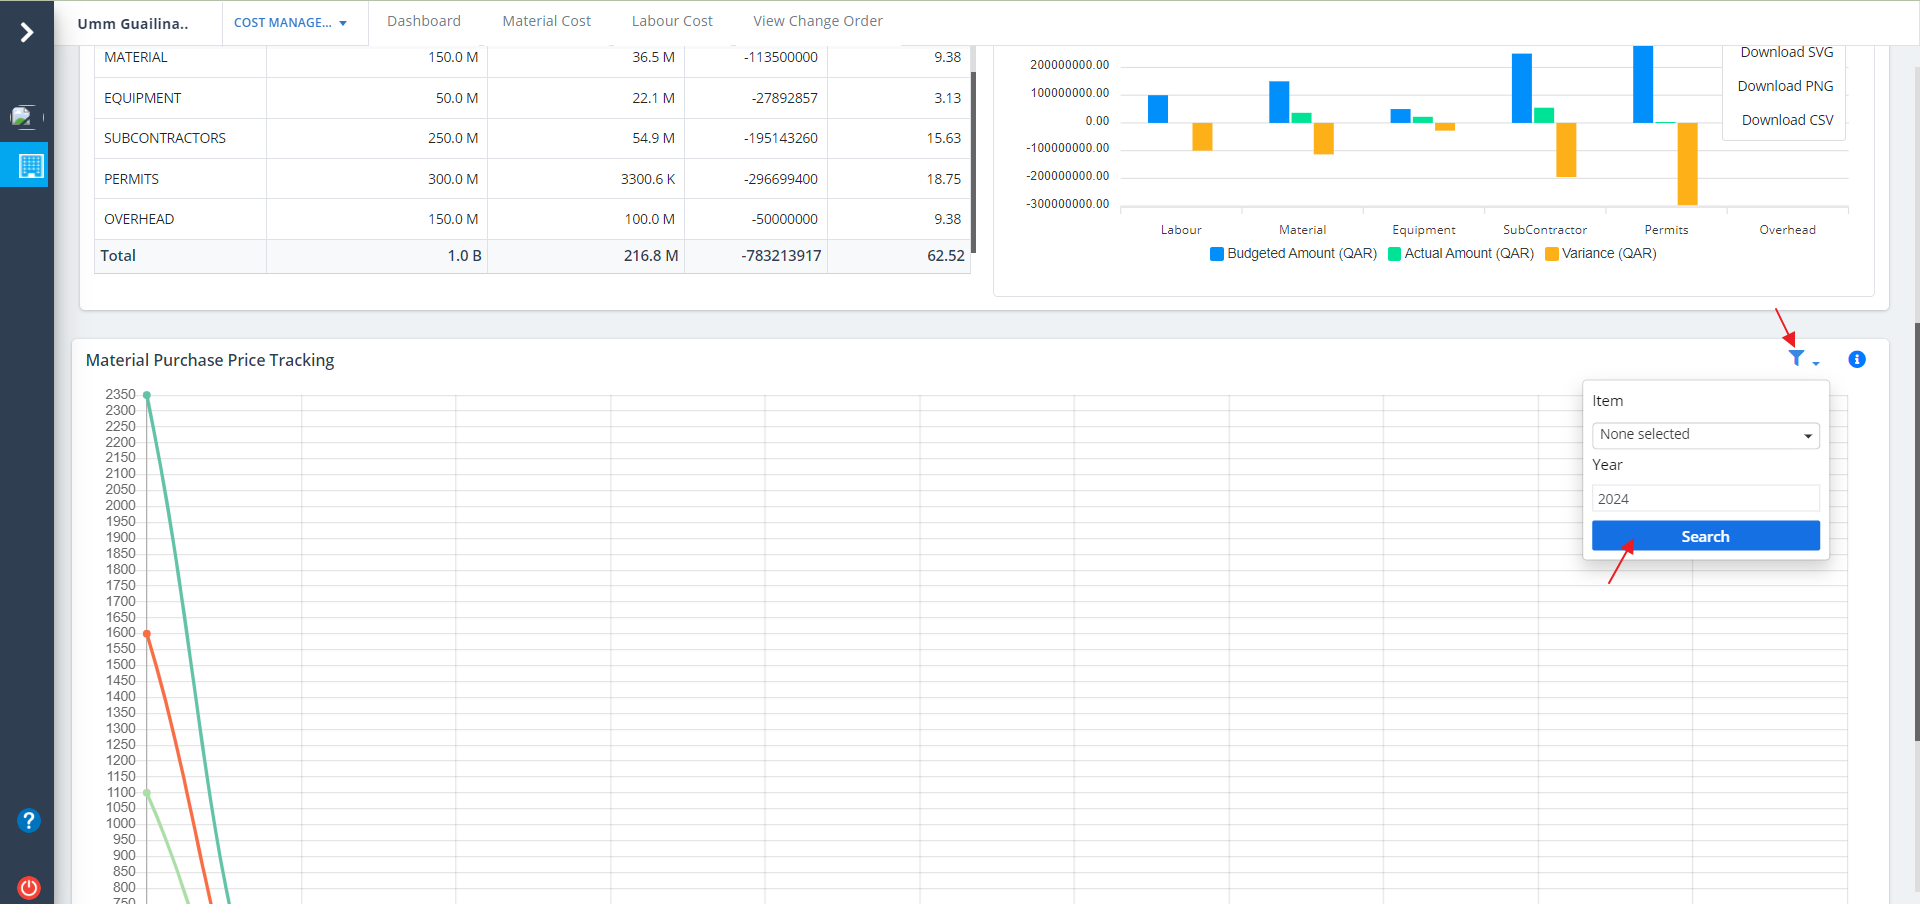
- Click on Exclamation button to view the material's budget. The same is segregated using different colors.