Dashboard Analytics
In the post pandemic world, keeping track of construction milestones to avert schedule slippages has become all the more essential. Skystruct is a solution crafted with inputs from industry experts and our dashboard embodies all metrics that are vital for your project.
- Project Timeline
- Budget Payment and Activity
- Assignment of tasks to authorized users
- Overall Progress
- Calendar
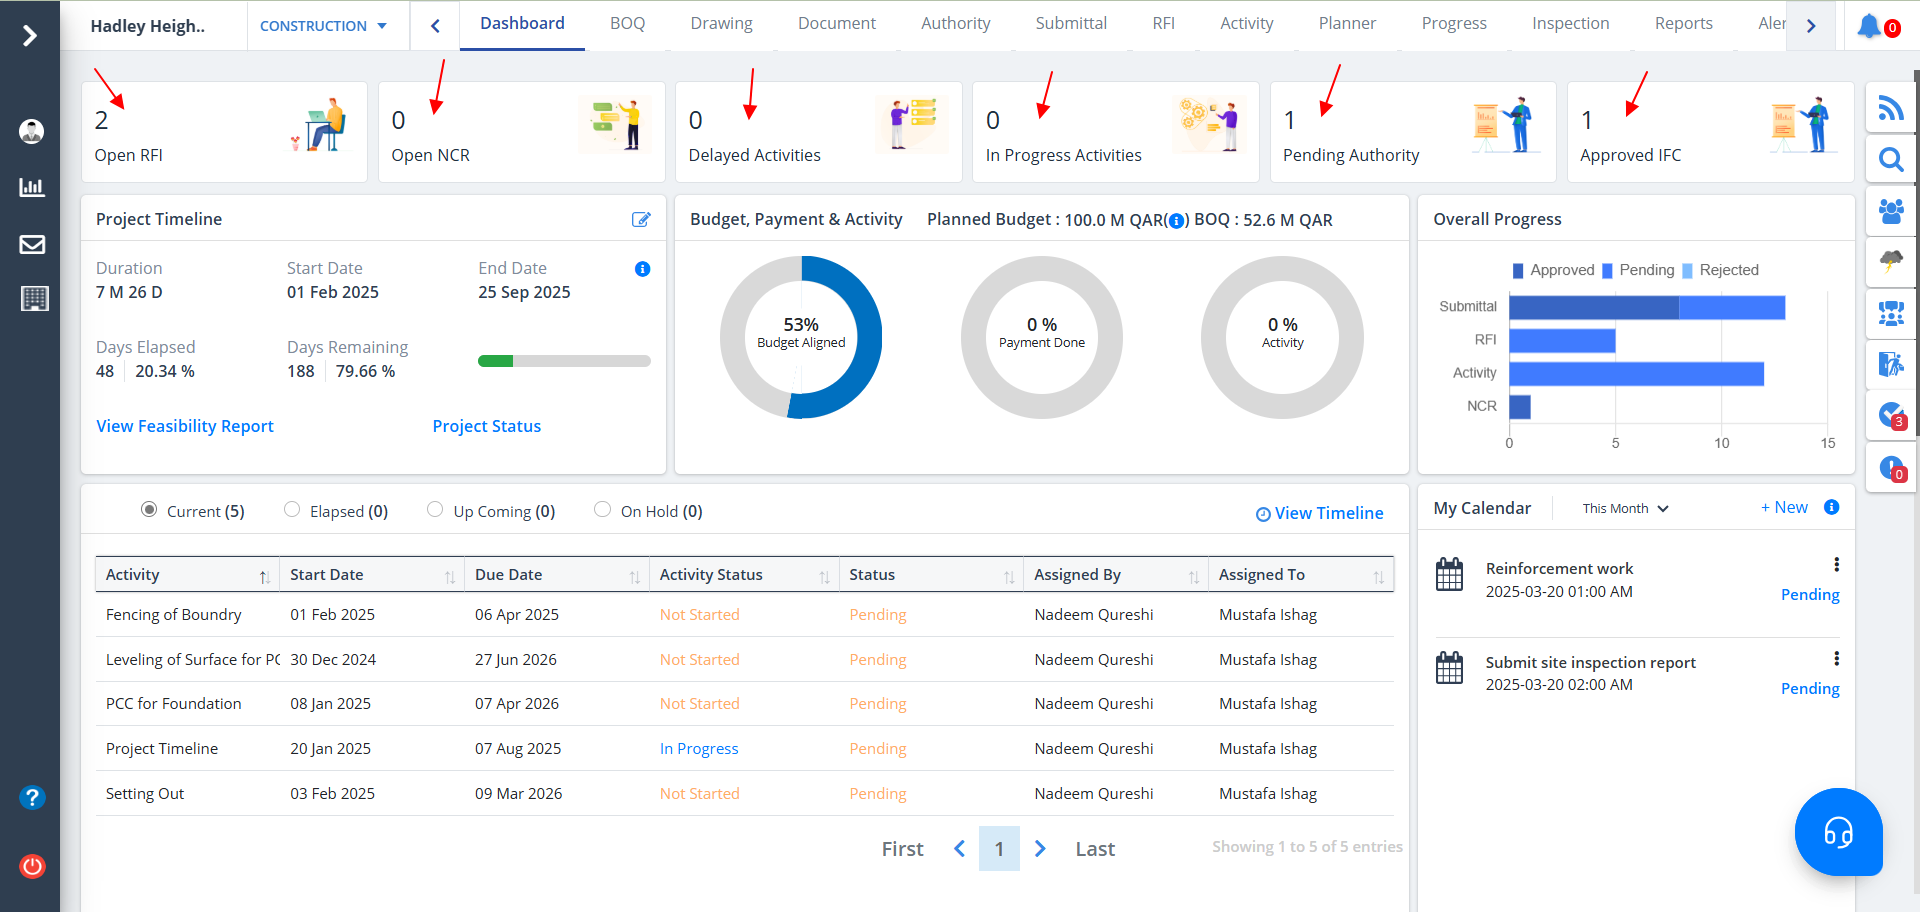
Analytics shows:-
- the RFI count where the status is Open
- the Non-Conformity Report (NCR) count where the status is Open
- number of tasks which are delayed
- number of In Progress activities
- authority count where the status of approval is Pending
- the IFC (Issued For Construction) count
Project Timeline
What is a Project Timeline?
A project timeline is a visual list of tasks or activities placed in chronological order,
which lets project managers view the entirety of the project plan in one place.
A project timeline typically takes the form of a horizontal bar chart, where each task is given a name
and a corresponding start and end date.
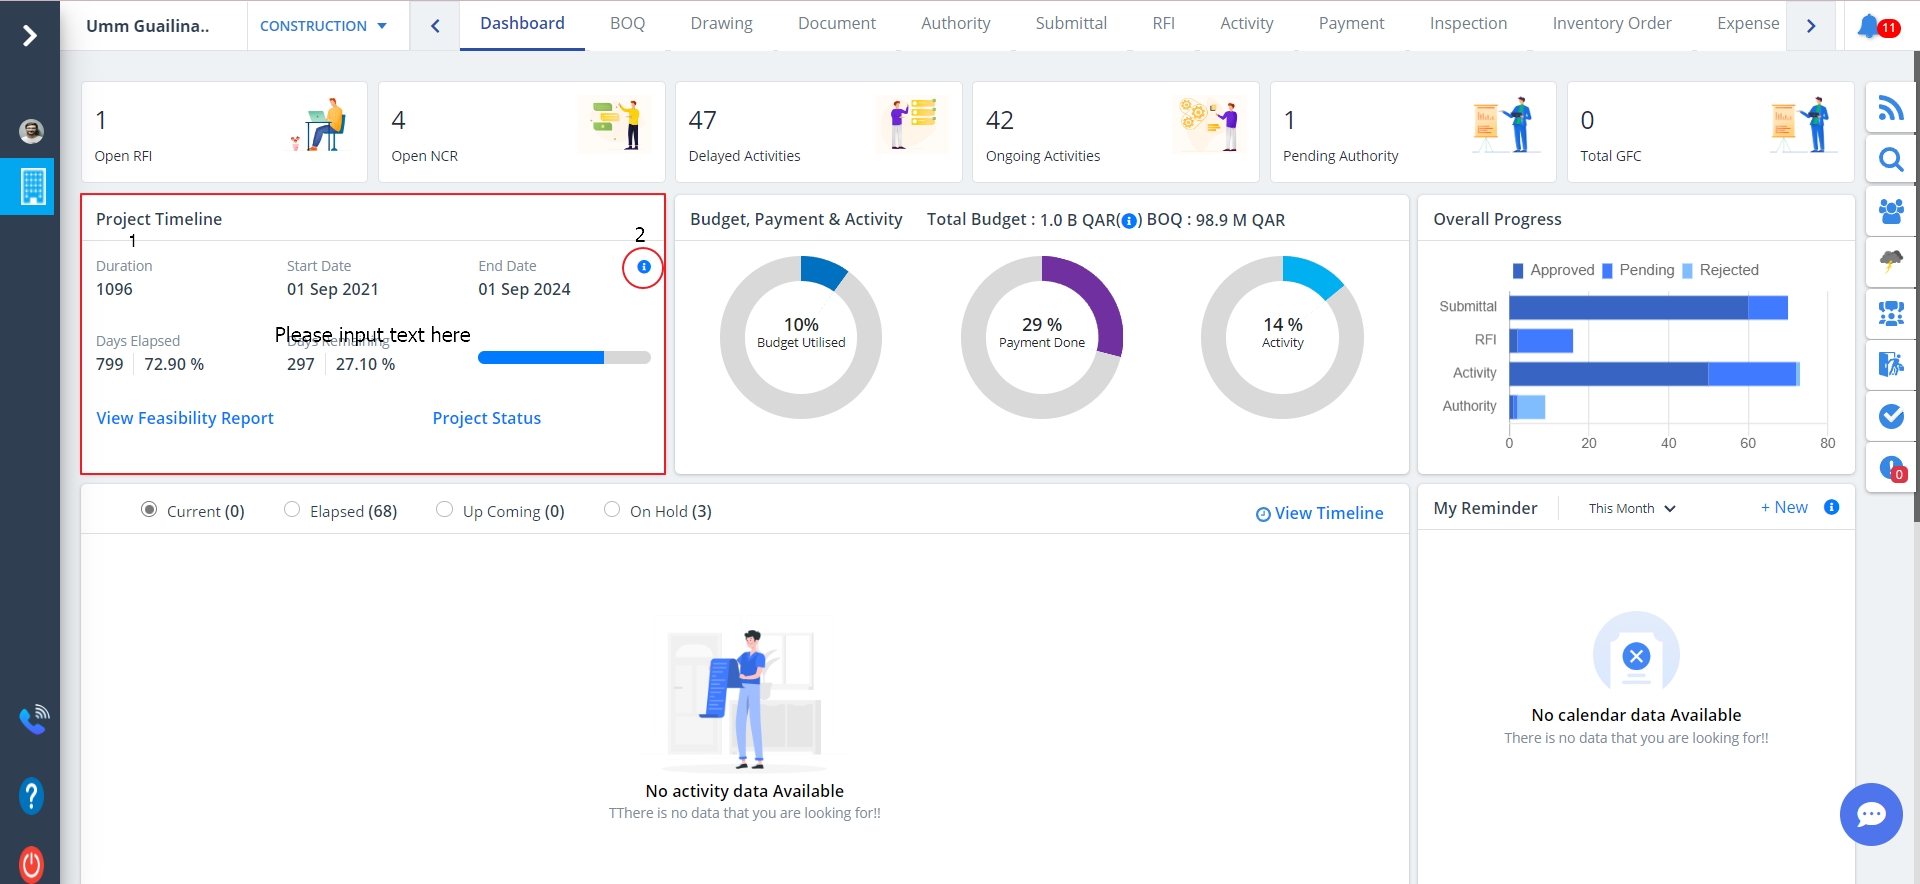
Project Timeline details are as follows:-
- Project Timeline can be noted in a nutshell.
- Paramount details are shown.
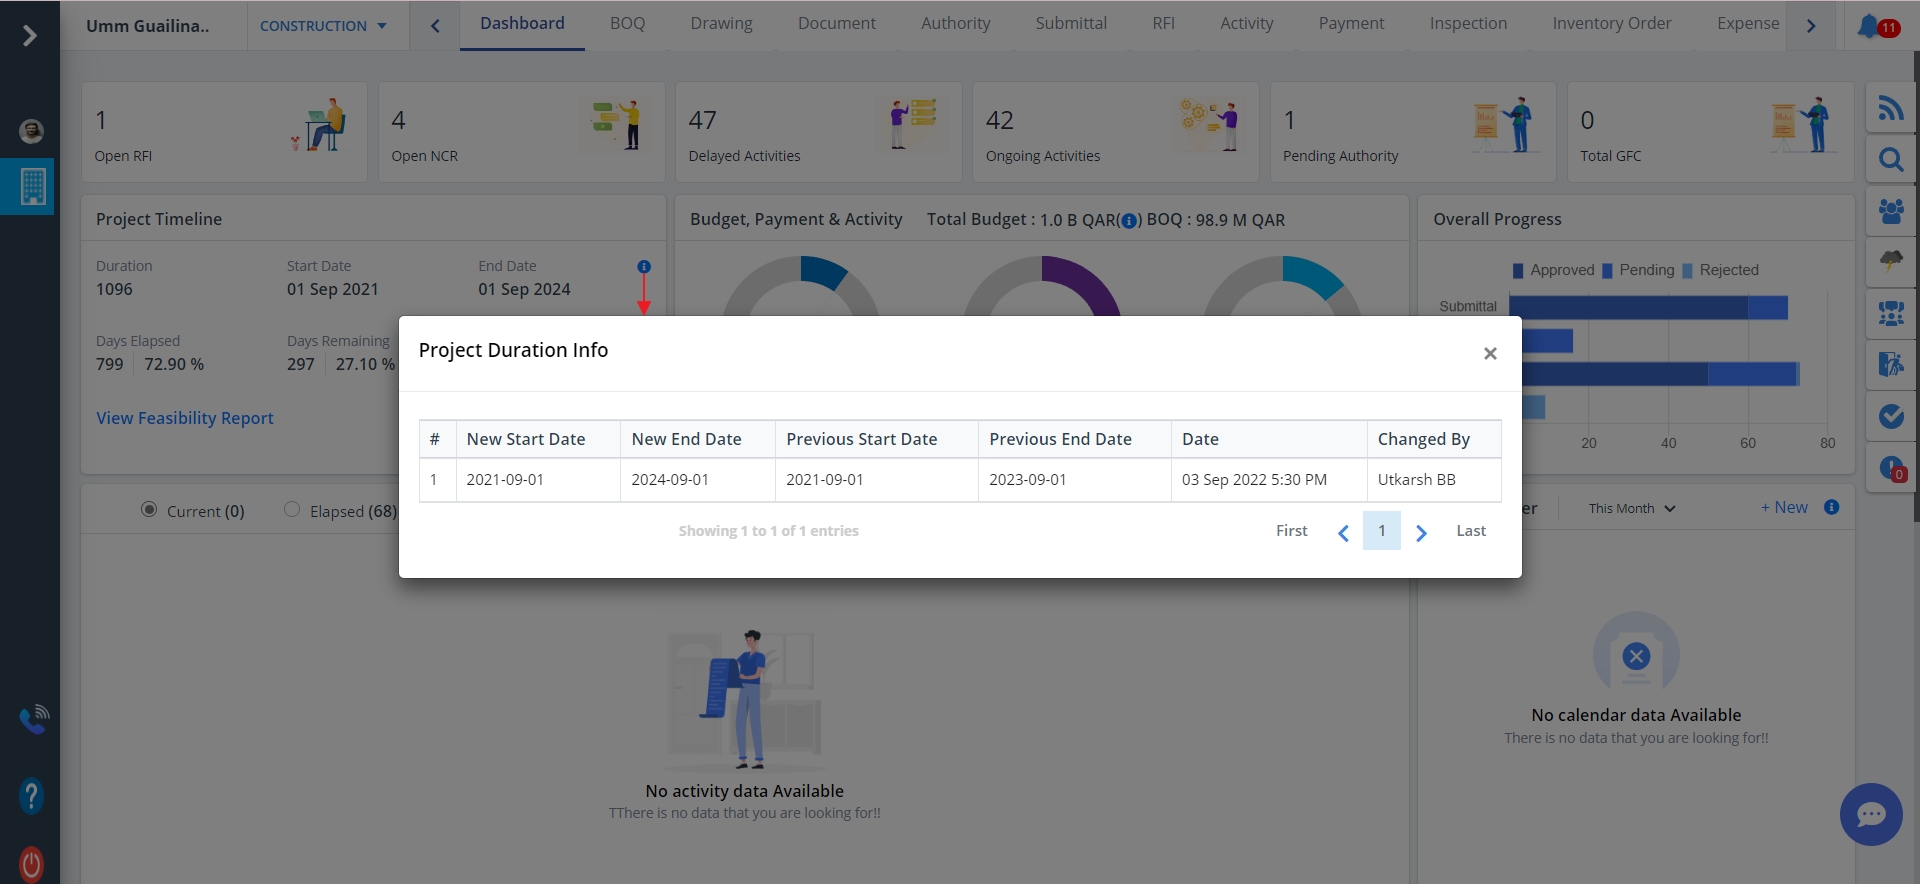
- Click on Exclamation (!) adjacent to the Project Timeline header to view the project details.
Feasibility Report
What is a feasibility report?
A feasibility report is a report that evaluates a set of proposed project paths
or solutions to determine if they are viable. The person who prepares a feasibility report
evaluates the feasibility of different solutions and then chooses their recommendation for
the best solution. They then present the feasibility report to their company and make their
recommendation.
What is the purpose of a feasibility report?
The purpose of a feasibility report is to determine the feasibility of solutions
or project paths and choose the best option. The feasibility report serves to break down
different approaches to a problem or project and help readers understand the feasibility
of each approach. Based on the evaluation outlined in the report, readers can decide whether to
take the report's recommendation of the best approach. This thorough analysis of different
approaches can help companies make the best possible decisions on projects and problems.
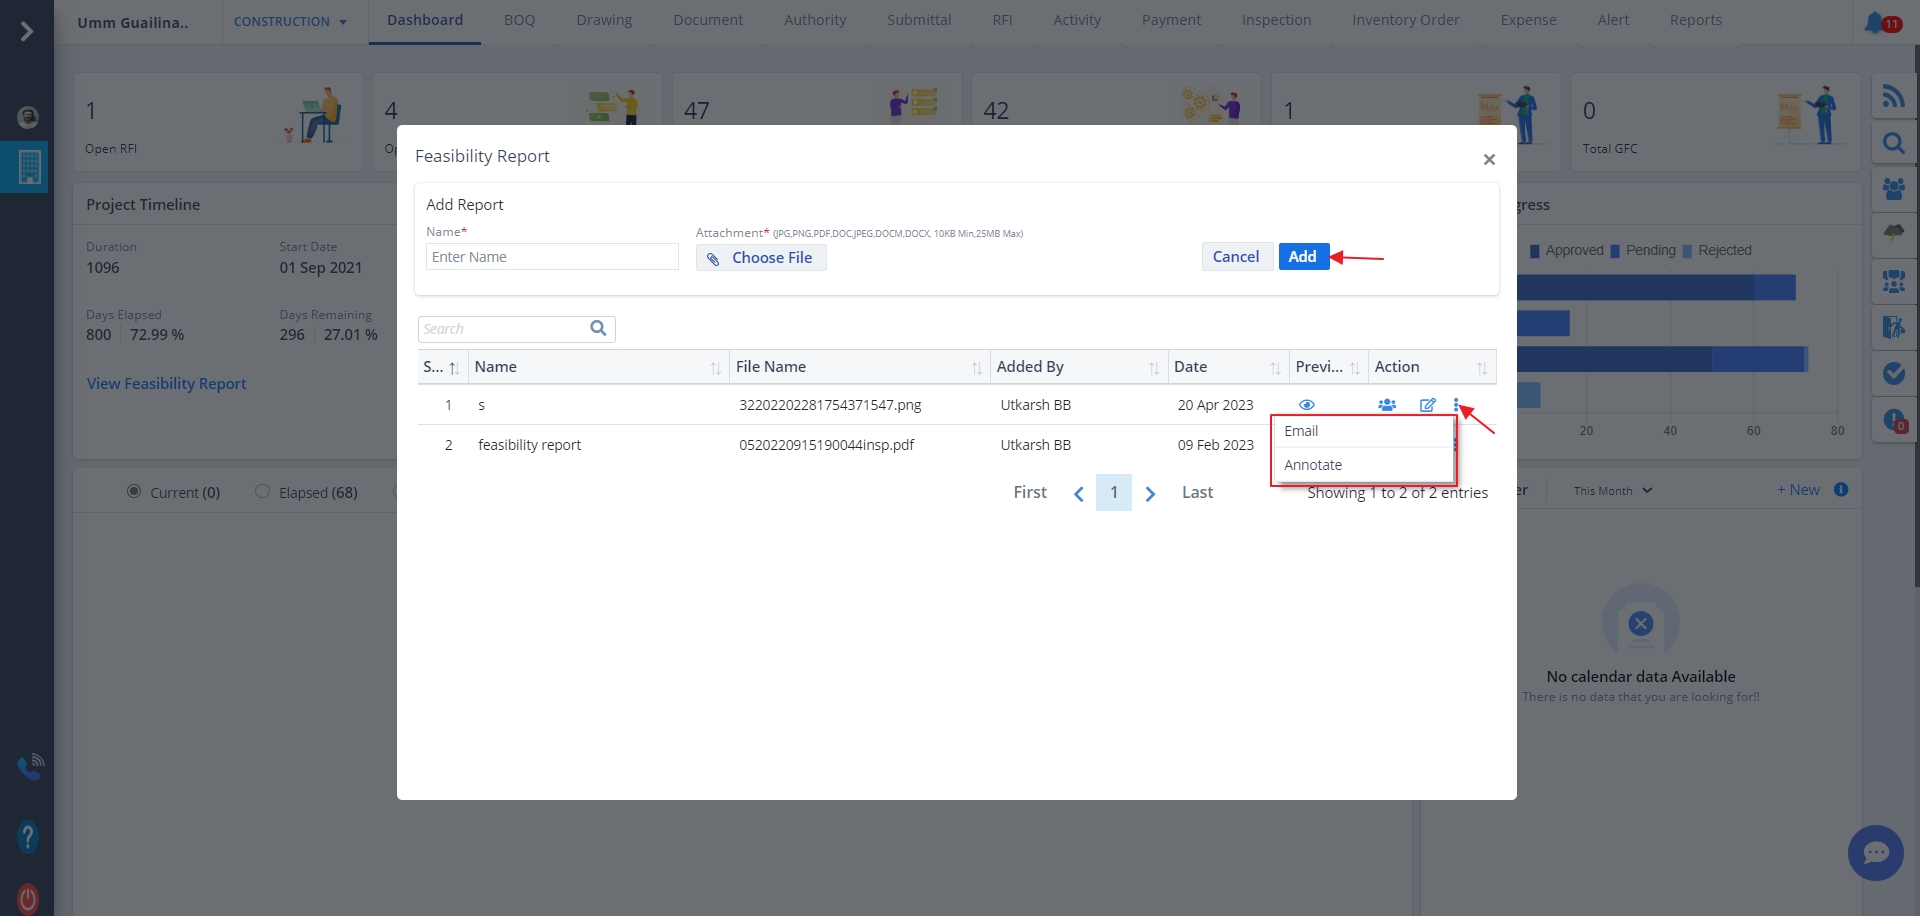
- Feasibilty Report can be viewed by clicking Feasibilty Report.
- Name the report and choose relevant file.
- Then click on Add.
- 3 dots can be for emails and annotations as shown.
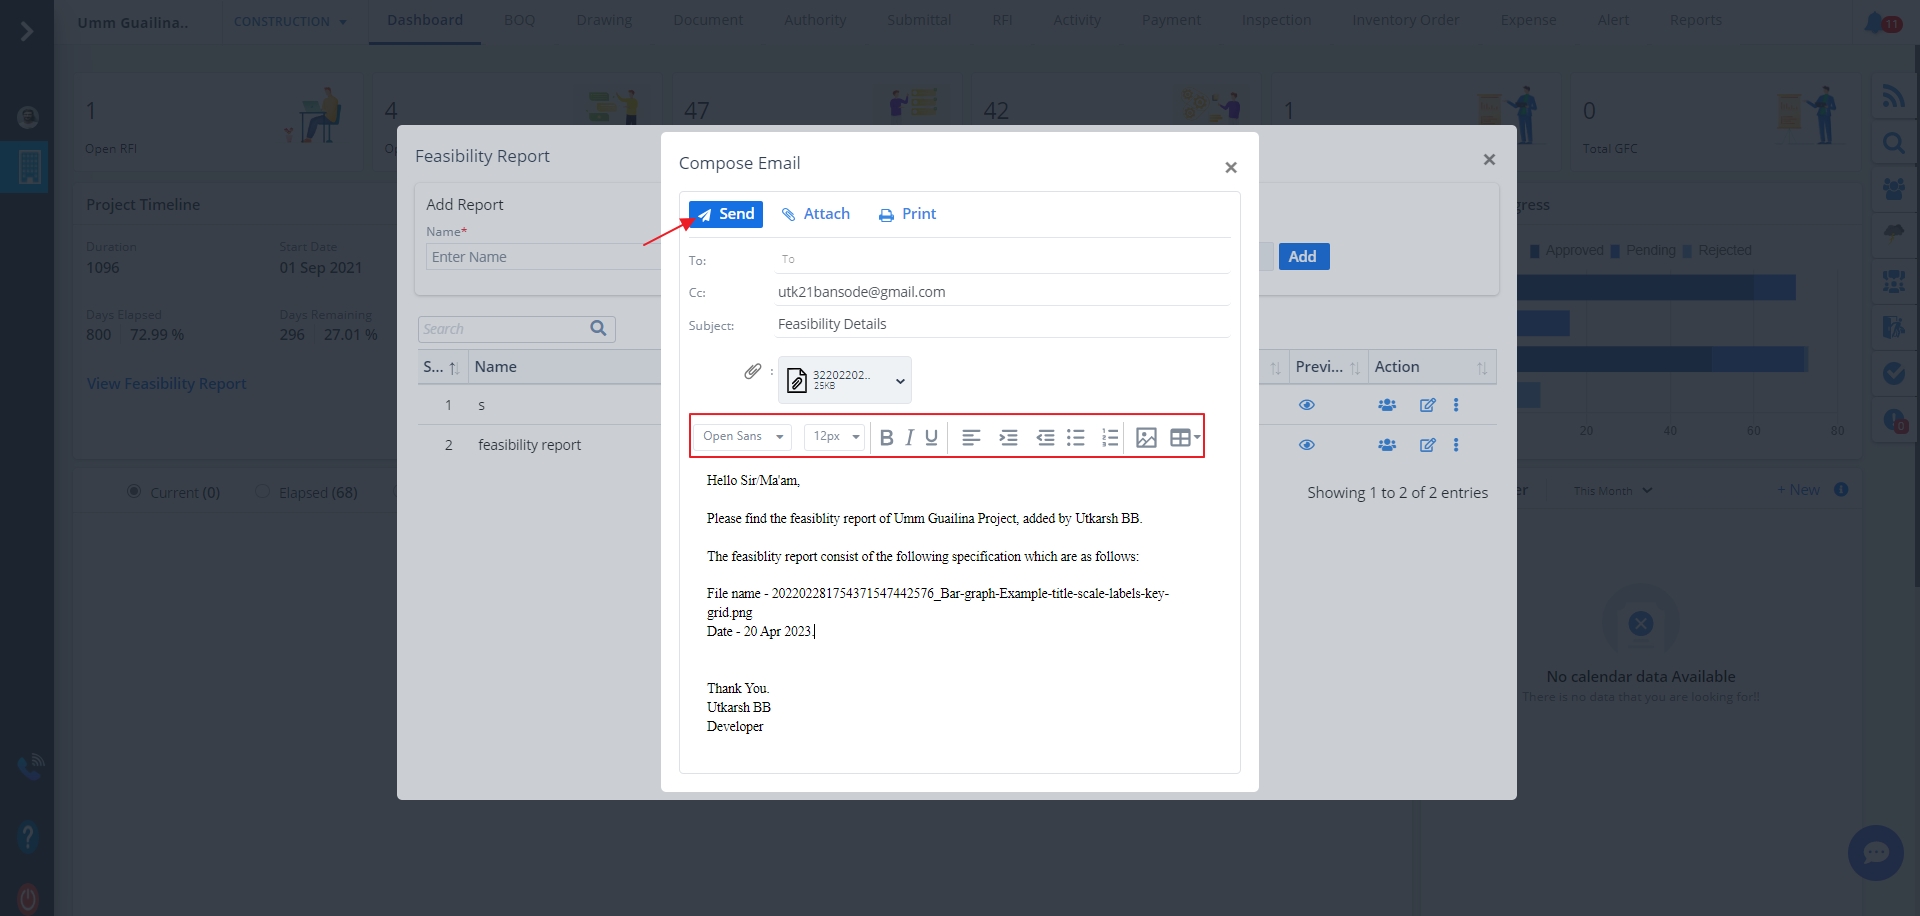
- Clicking on Email displays 3 options; Send, Attach, Print. Use these options as per your requirement.
- Use the Edit options shown below while composing an email.
- Just click on Send when done.
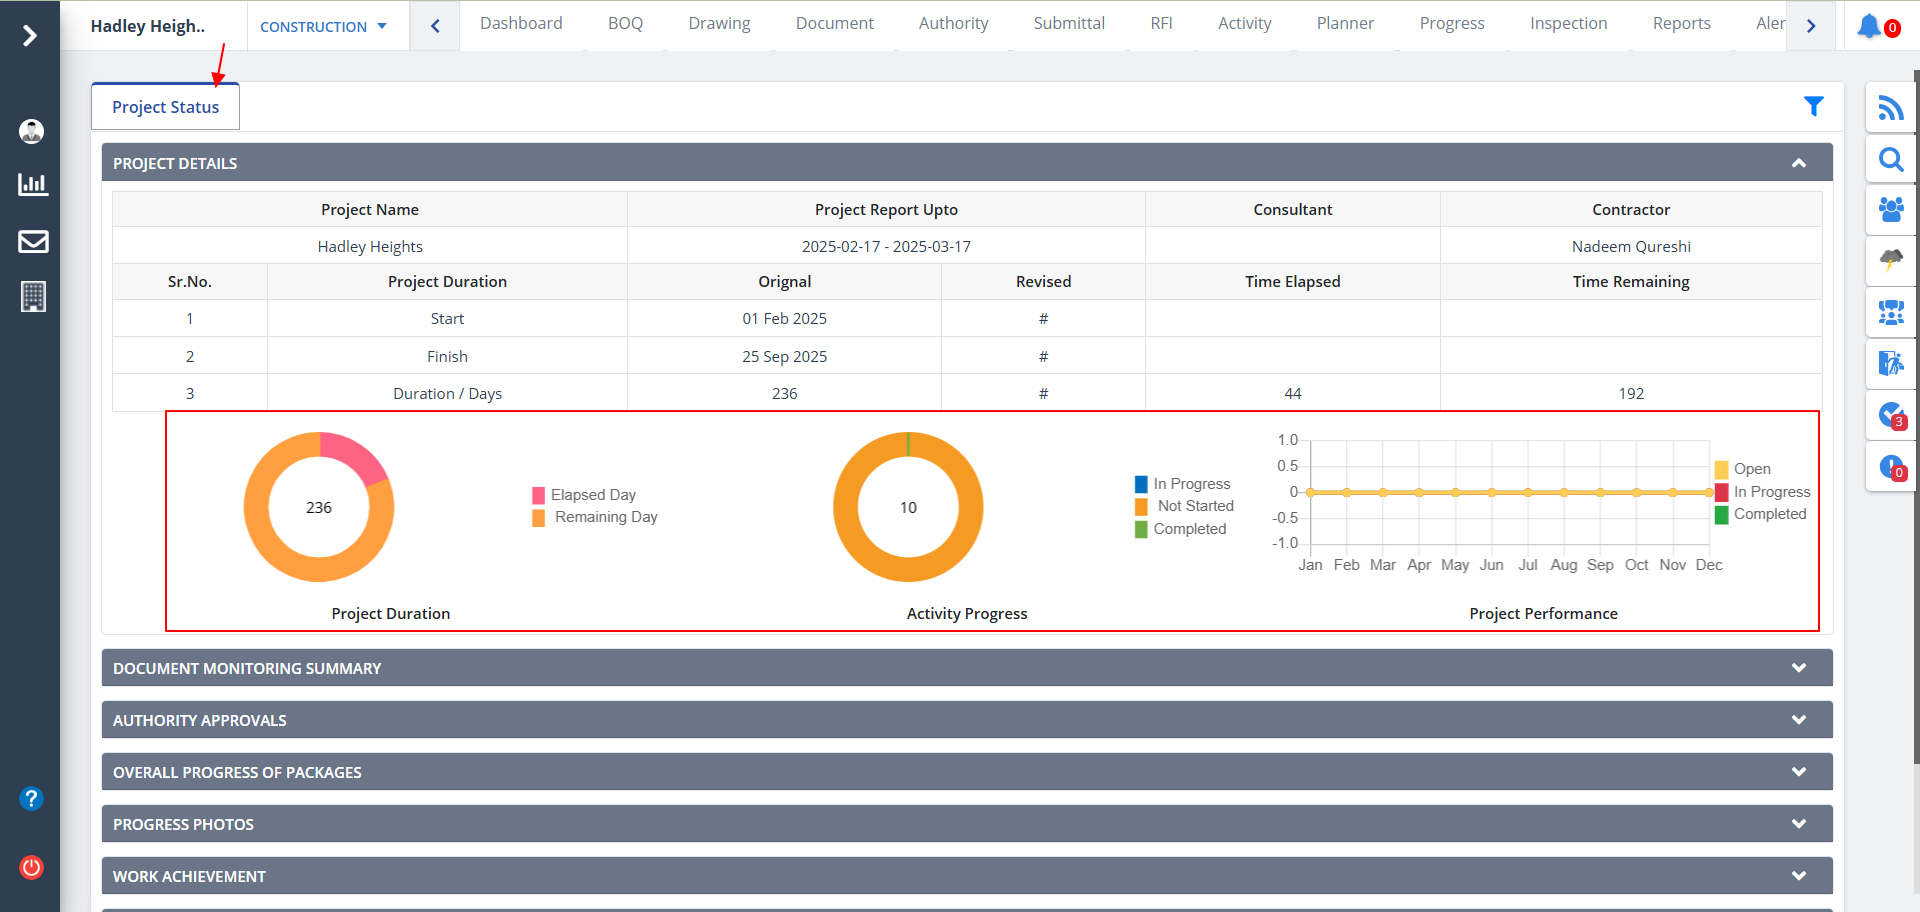
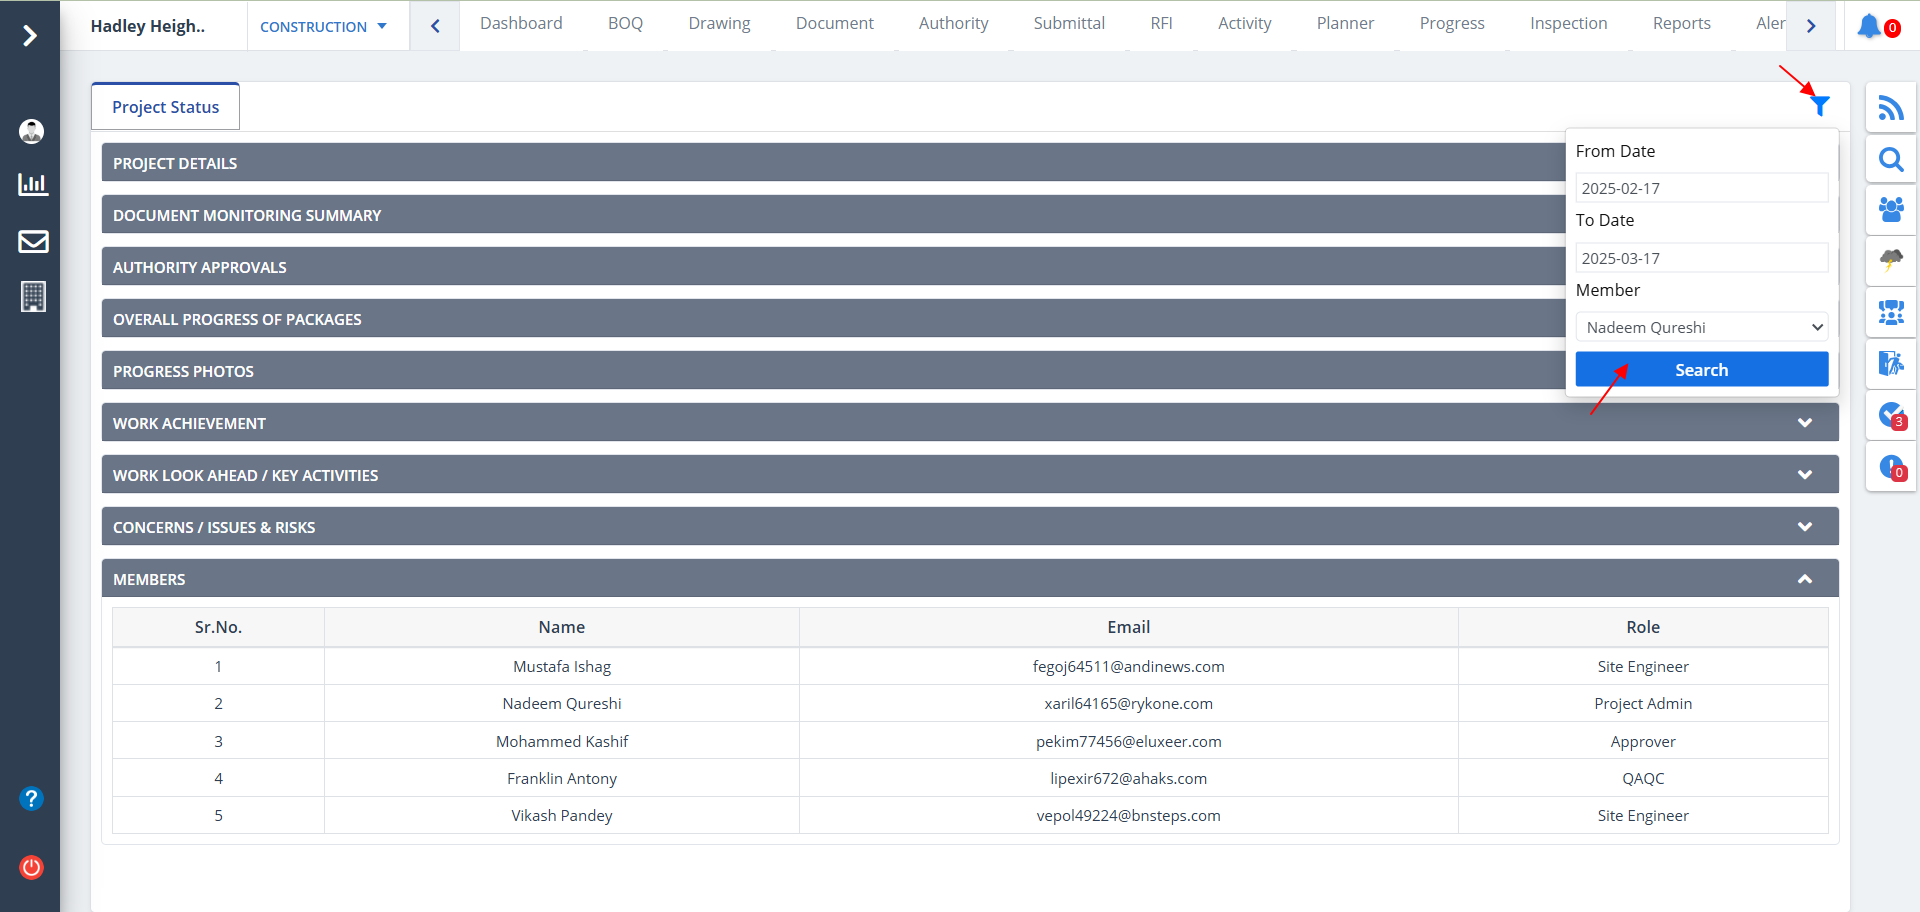
- Extensive description of the project status can be noted by clicking on Project Status next to View Feasibility Report.
- Project status can appear as a simple tag or icon on a report that indicates the progress being made in each stage of a project's completion.
- Many project statuses use colors to represent different levels of progress, such as marking tasks that are progressing on task as green and marking tasks that are behind as red.
- The Project Duration, Activity Progress and Project Performance is incorporated using diagrams.
- Project Duration - Duration is the total time that it takes to complete a project measured in work days, hours or weeks.
- Activity Progress - Shows the activities completed in percentage.
- Project Performance - The performance of the project, determined using Feedback, including the performance of the project team and the performance of the building against the desired Project Outcomes.
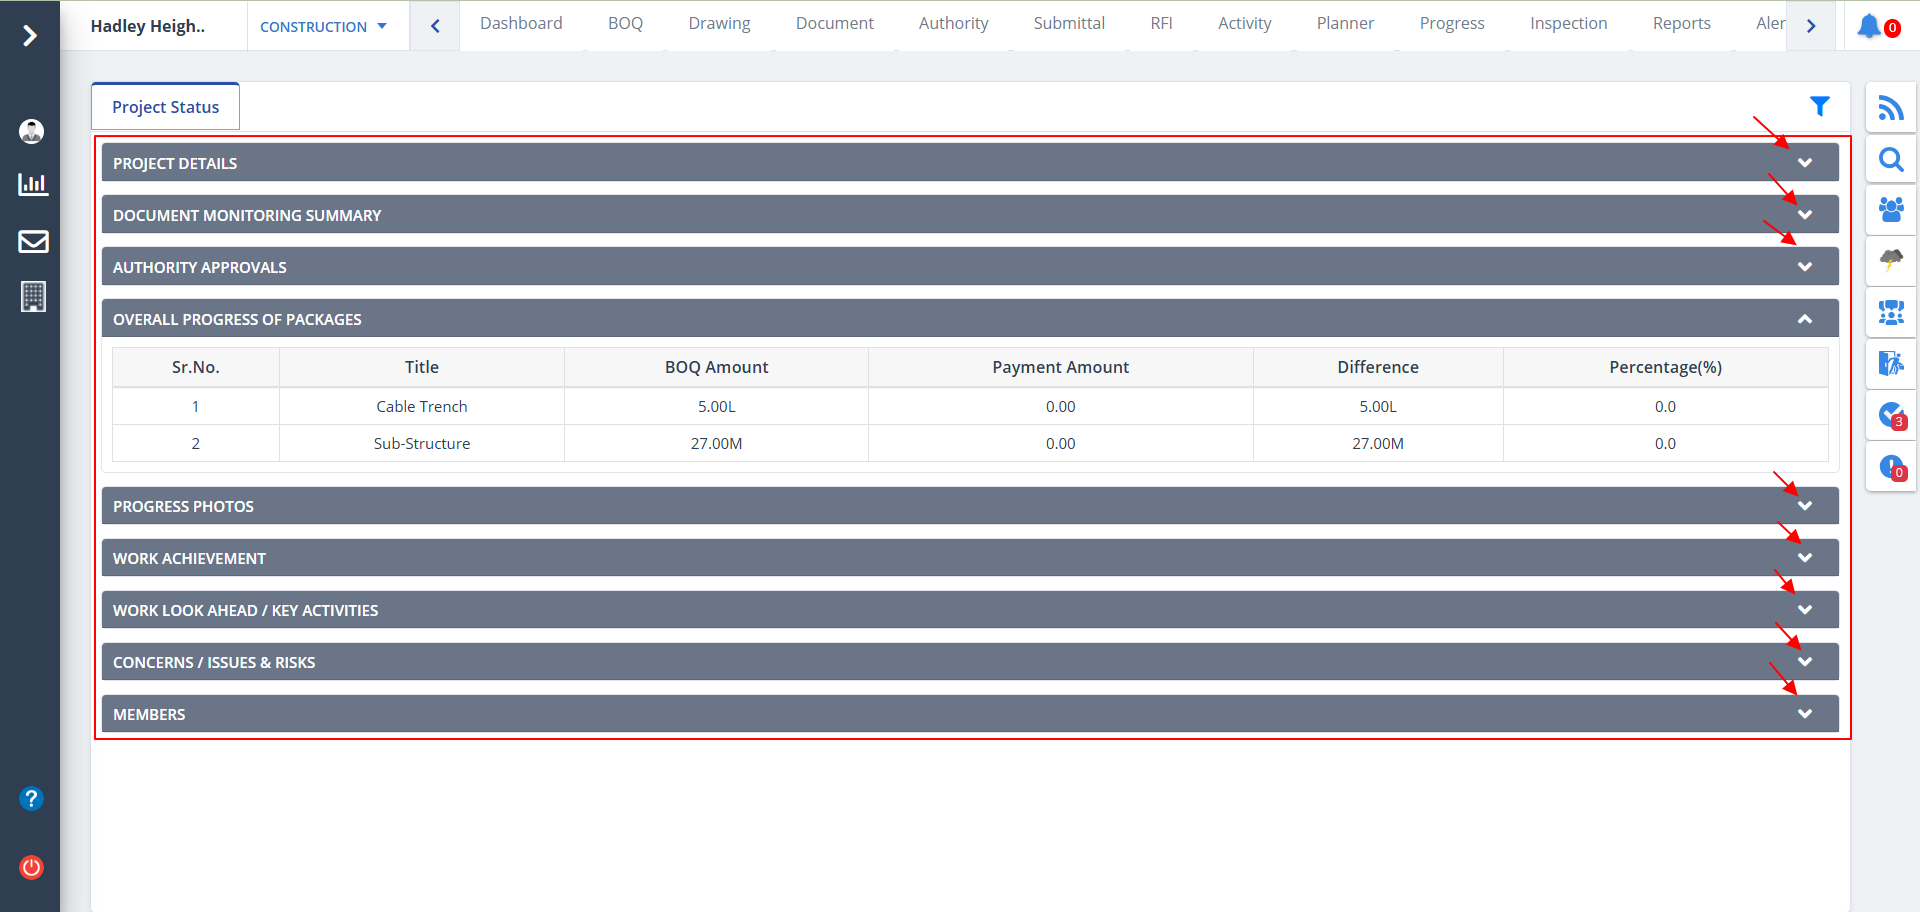
- If you scroll a bit down, you will find different report types.
- Click on each of them to view a detailed report.
- A construction project report should have all the specifications of the project. The construction team must first be able to identify all the areas of the project so they will know the items that they need to update and report.
- Below figure shows the different report types.
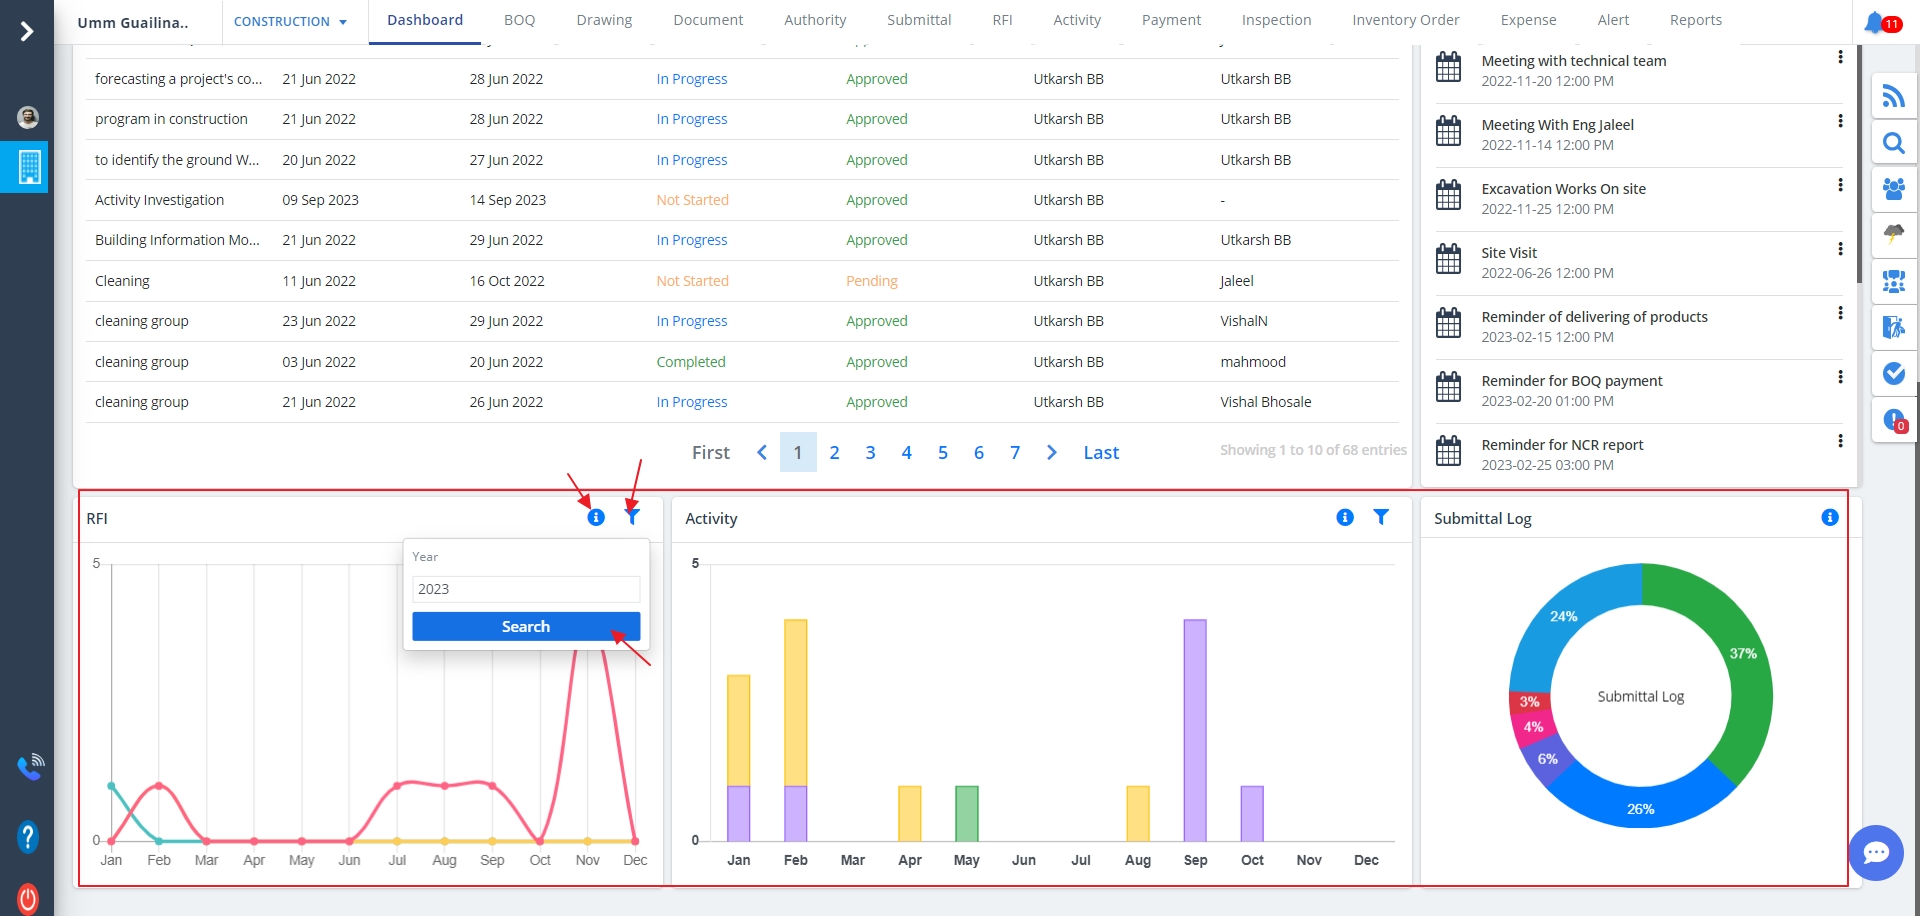
- Click on Filter icon to filter aspects by date, contractor and consultant.
- Now click Search.
- Data will be listed based on the filter you provided.
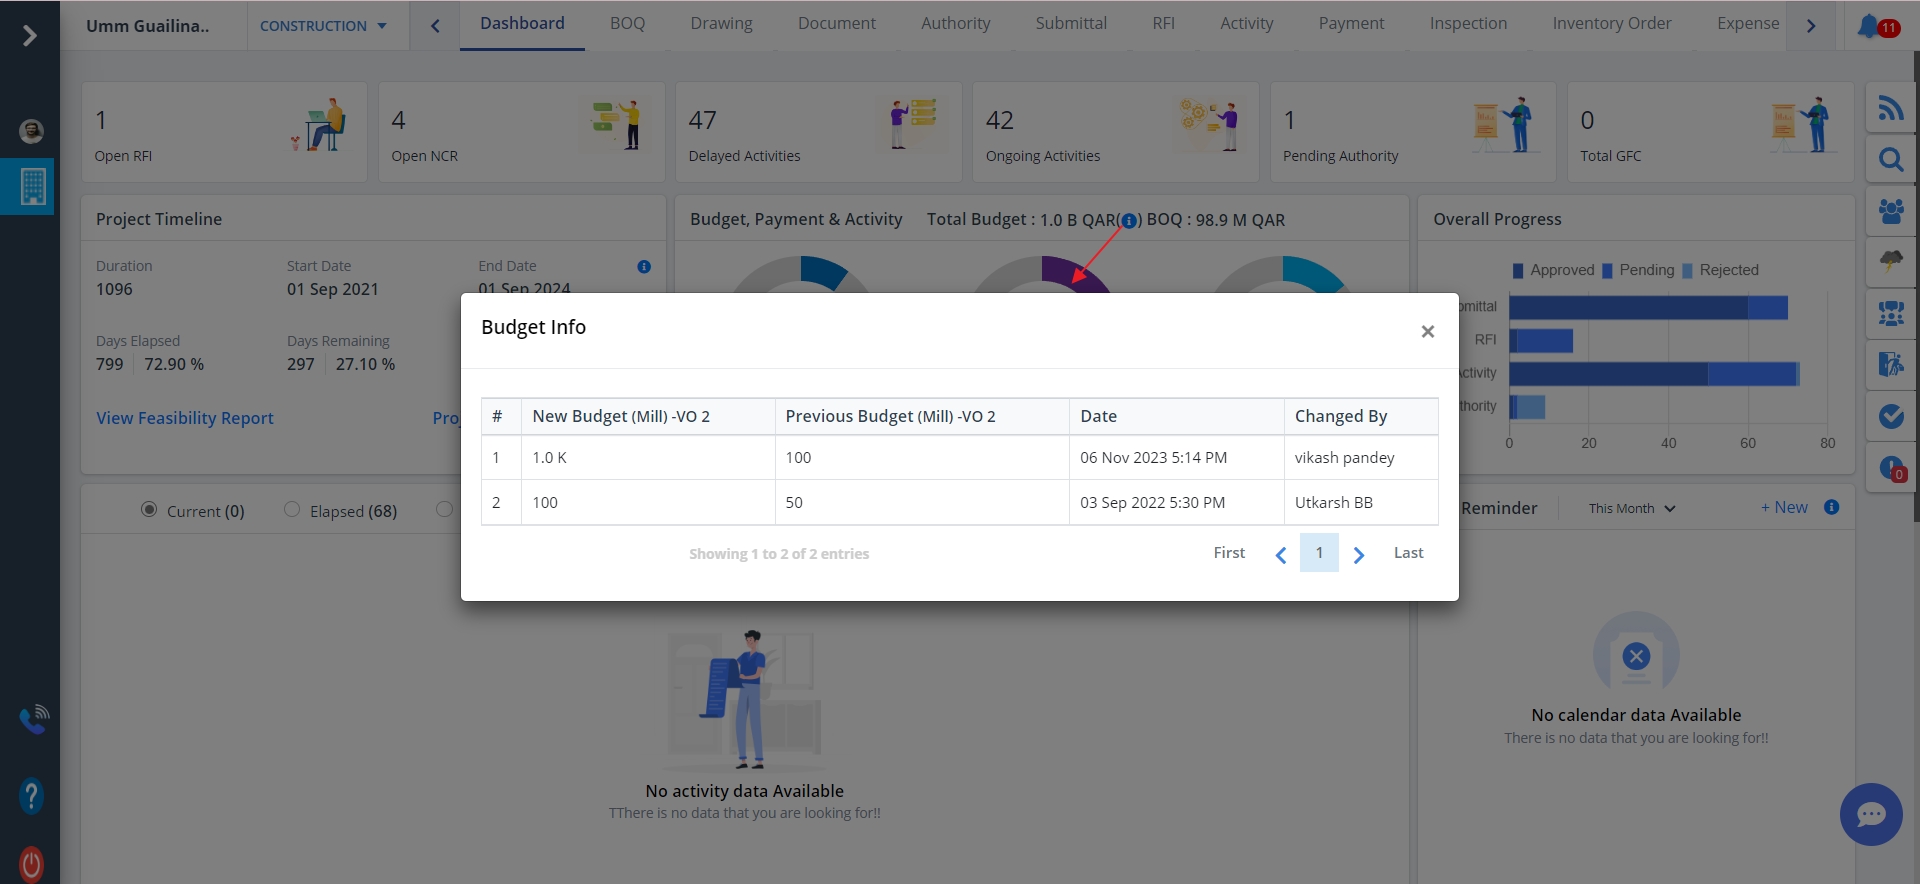
- Click on Exclamation (i) as depicted to view the budget information in short.
- Some important factors are shown.
- The names of the activities and their stages. Stages can be viewed by clicking the dropdown arrow as shown.
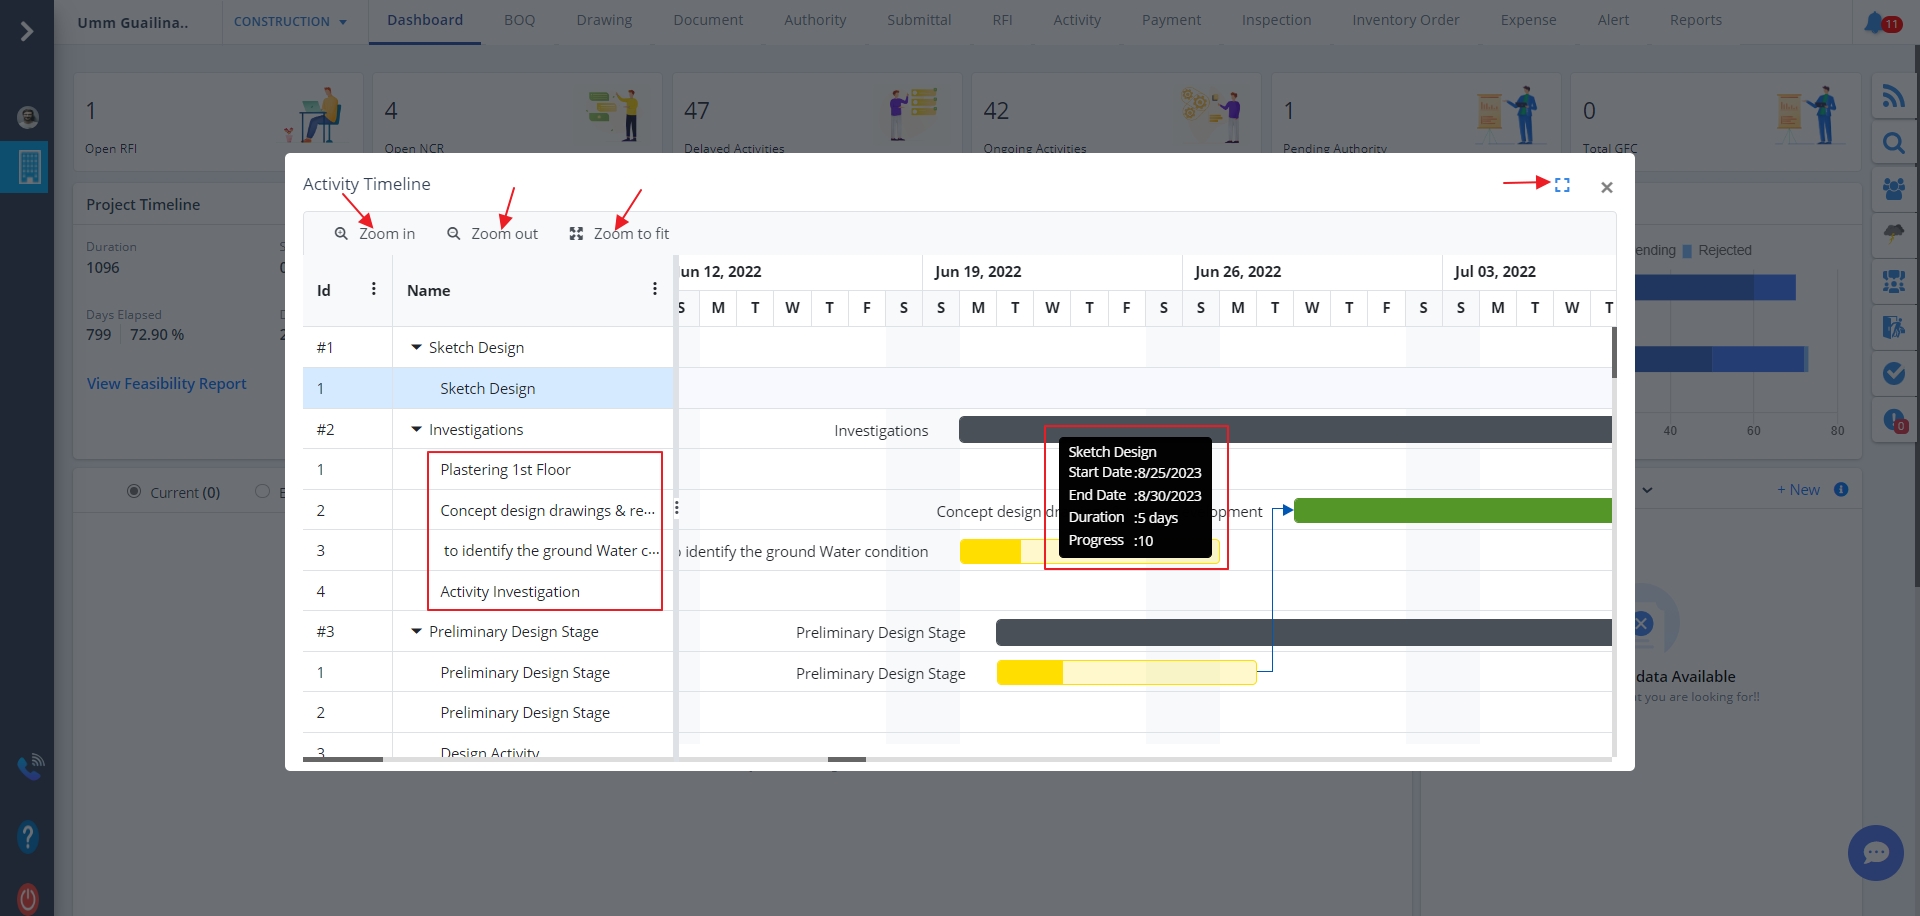
- Hovering on any of the bars will display the stage name along with start and end dates, their duration as well as progress.
- Clicking on any of the bars will highlight the respective activity.
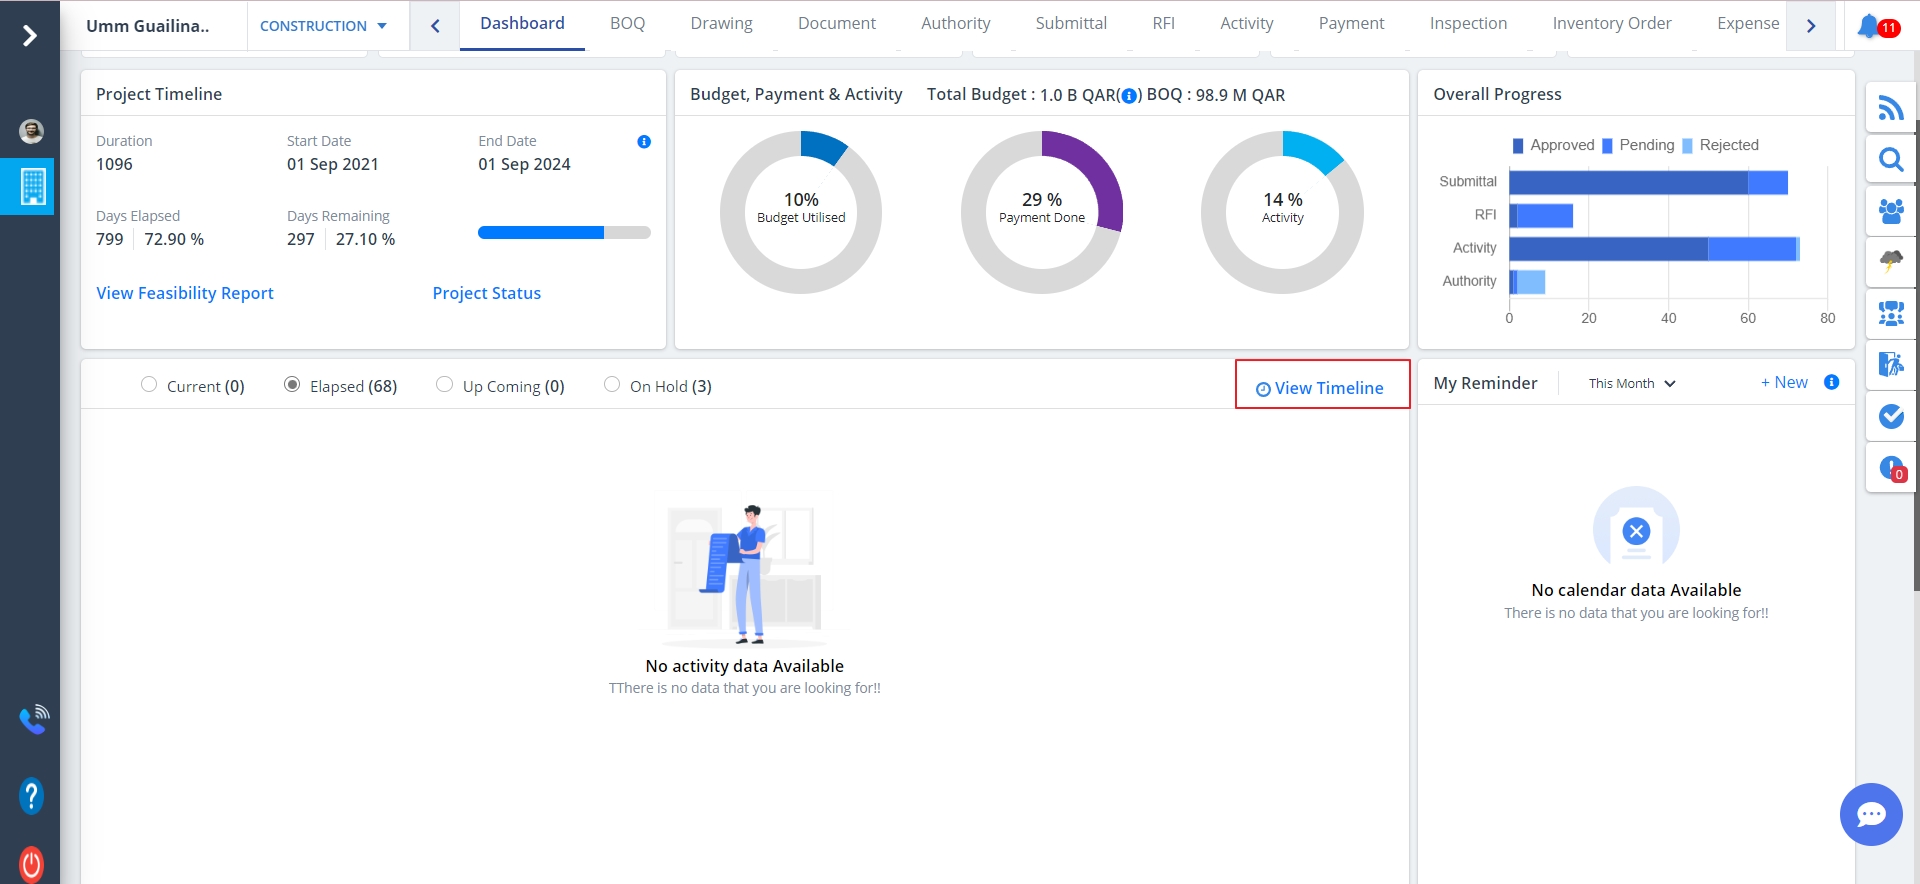
- To view timeline, click on View Timeline as depicted.
- Hover over any of the rows to view the Task/Activity details exhaustively.
- Scrollbars are provided for top to bottom, left to right and vice-versa viewing.
- The progress percentage of each activity is shown.
- You can use zoom in, zoom out buttons to zoom in and zoom out respectively.
- Fit to screen allows you to fit the gantt in the div.
- Use the full screen feature provided to view the Gantt with a detailed explanation. Full screen view for the same will be as shown in the below figure. Click on the depicted icon to exit full screen. Close button to close the entire Gantt Chart.
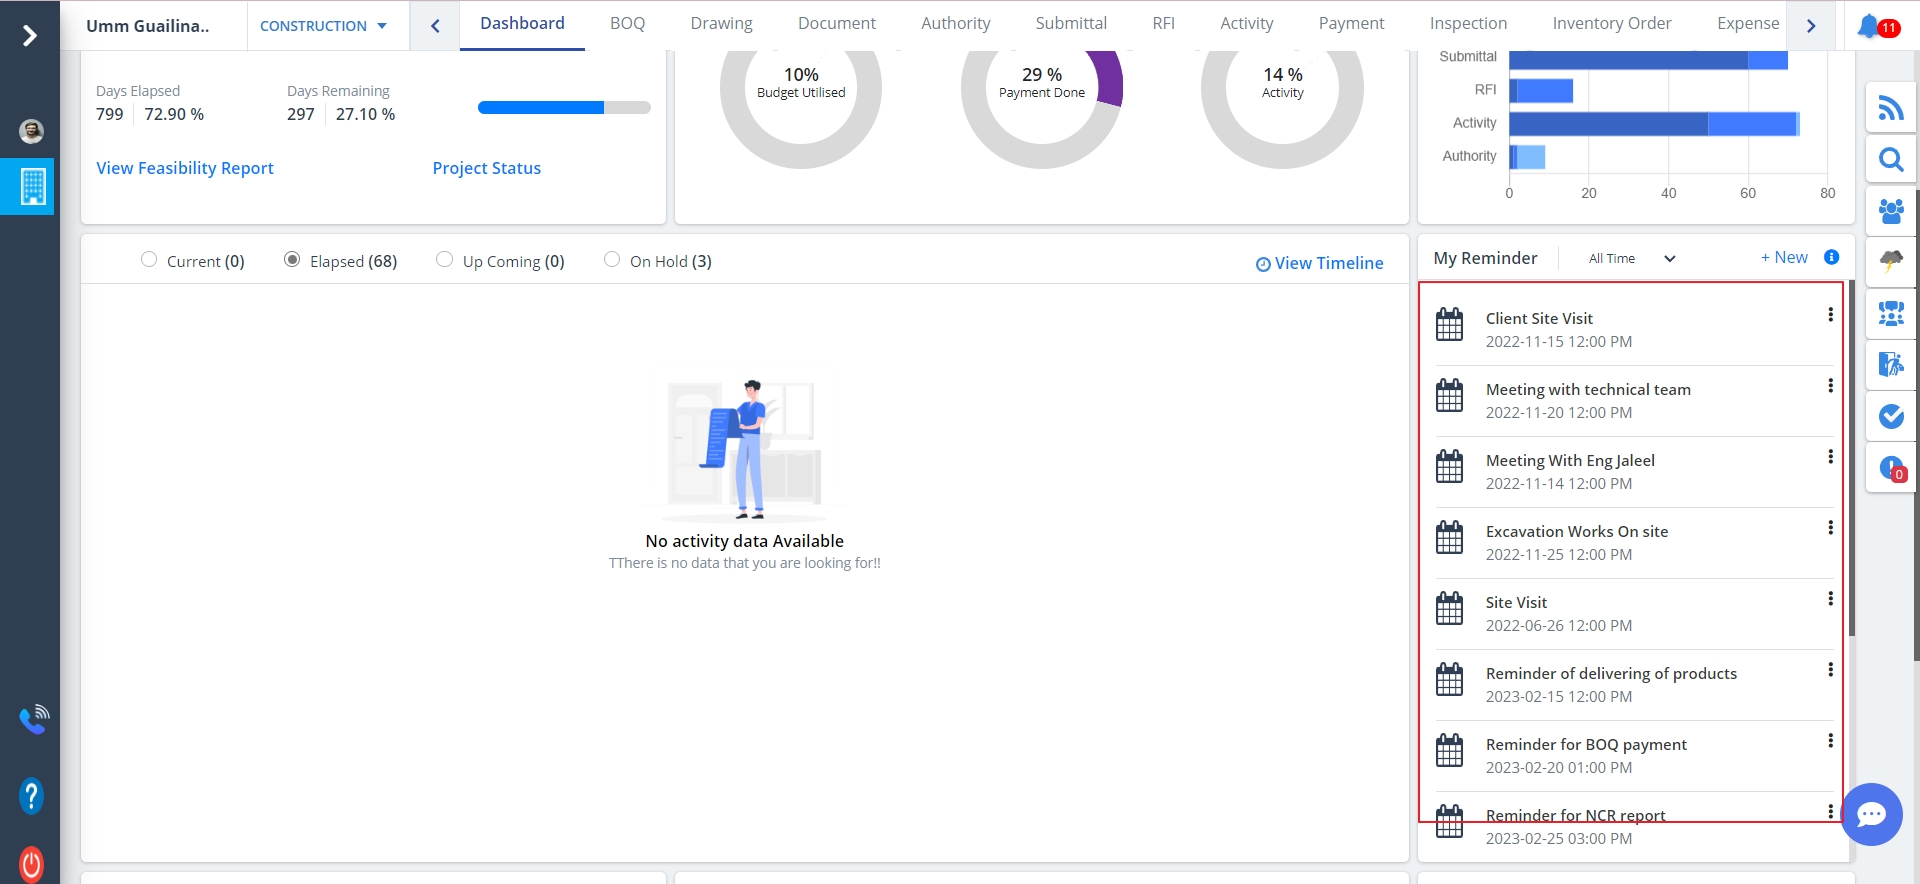
- Reminders can be added so that you get notified of a meeting or a visit or some other of the same kind that has been planned.
- A filter is present as shown.
- You can filter by duration; Ex. Last month, last week, etc.
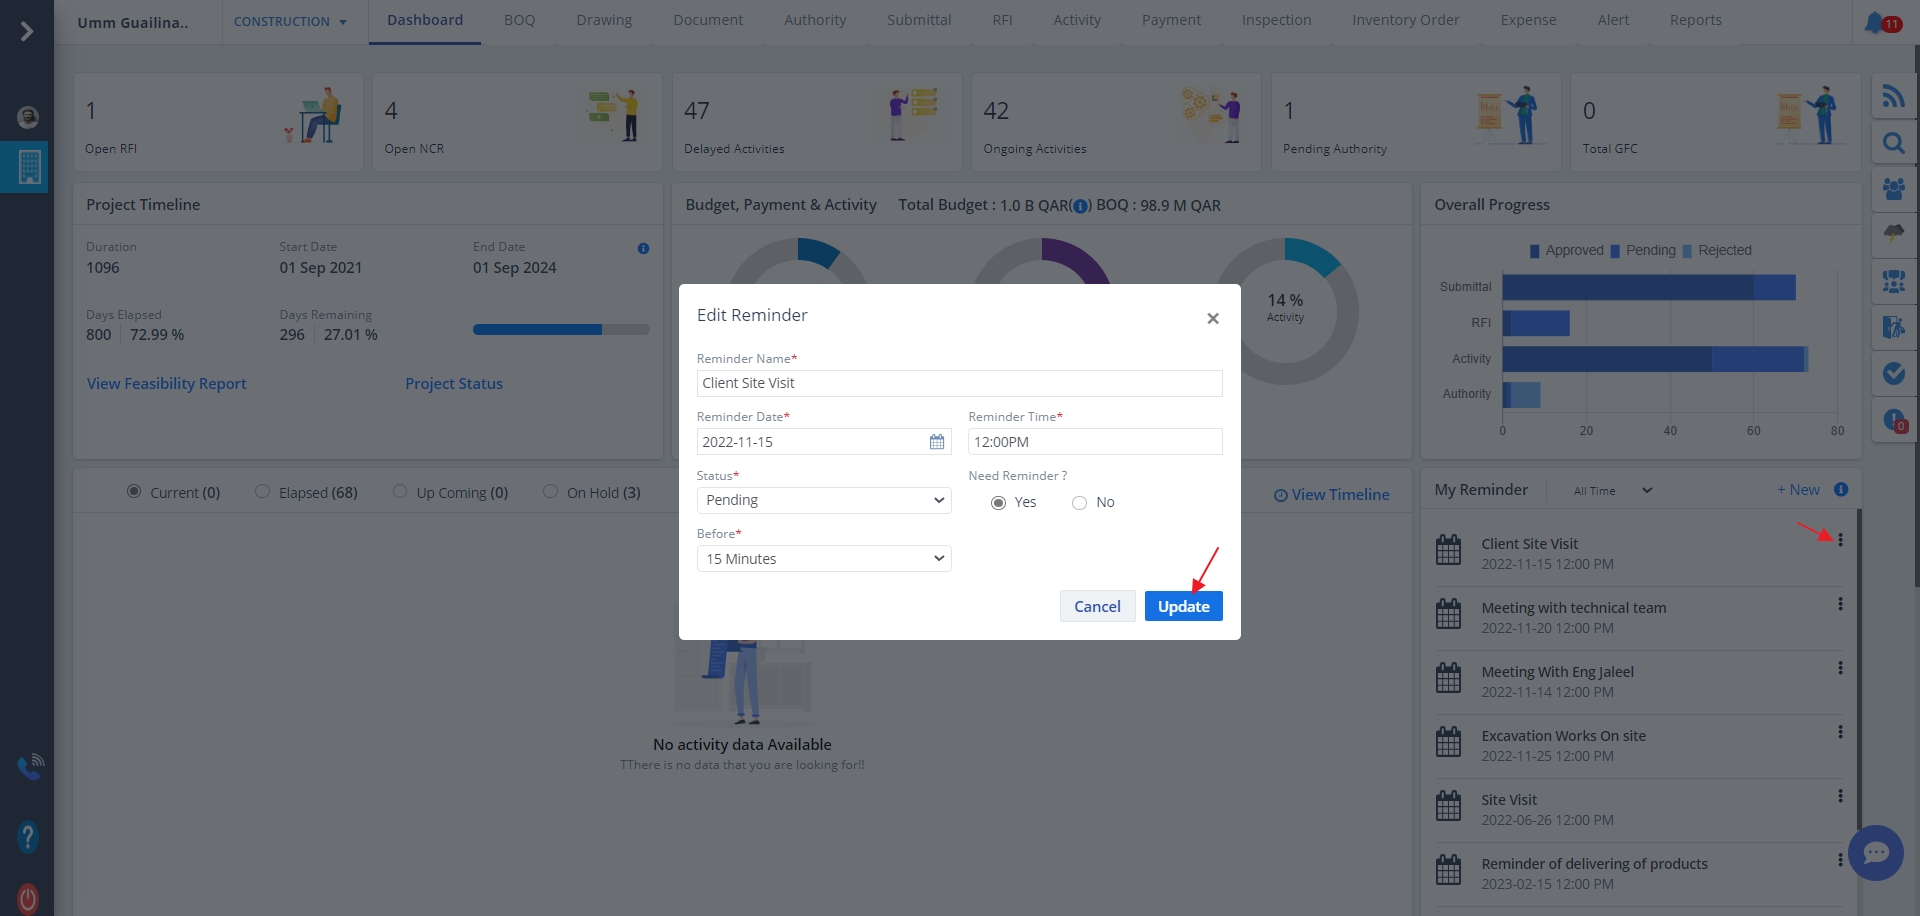
- If reminders have been added already you can edit it by clicking the Edit.
- Enter data and click on Update.
- You can choose the No radio option if you just want to mention a reminder but doesn't want it to remind you.
- You can even set the prior time for your reminder, so that it reminds you prior mentioned time.
- Reminders can be deleted too. Just click on Kebab Menu as shown.
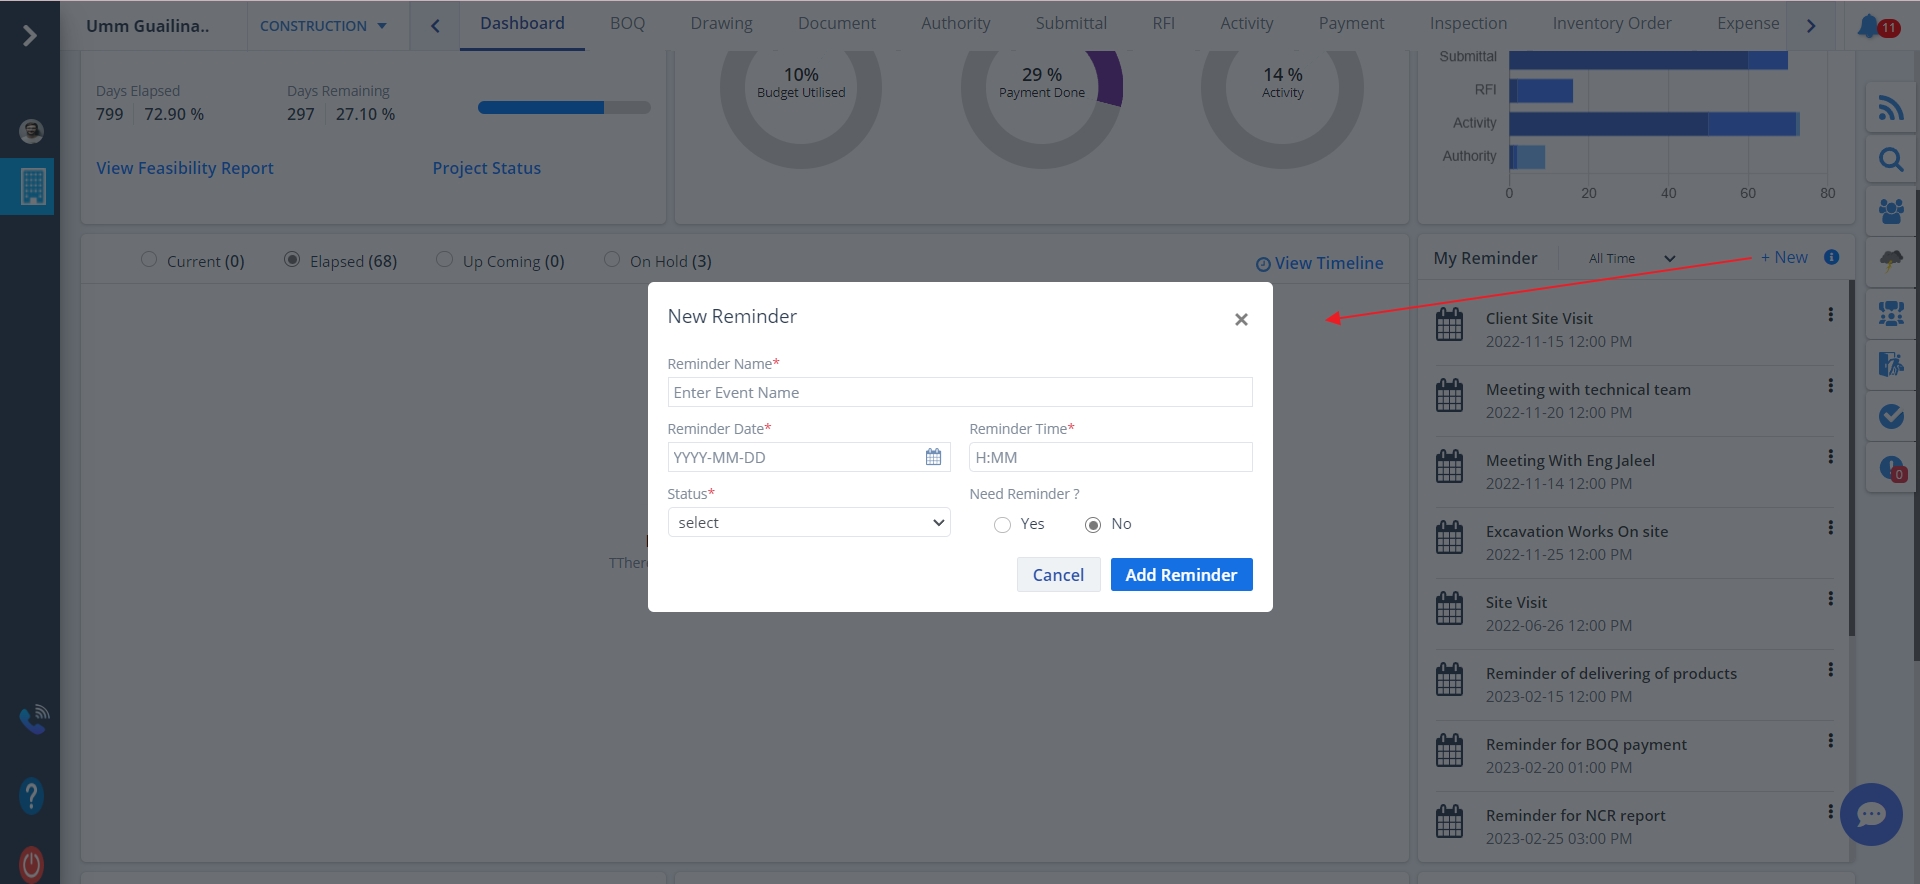
- To add a new reminder, click New.
- Enter data and click on Add Reminder.
- The list gets updated right away.
- You can choose the No radio option if you just want to mention a reminder but doesn't want it to remind you.
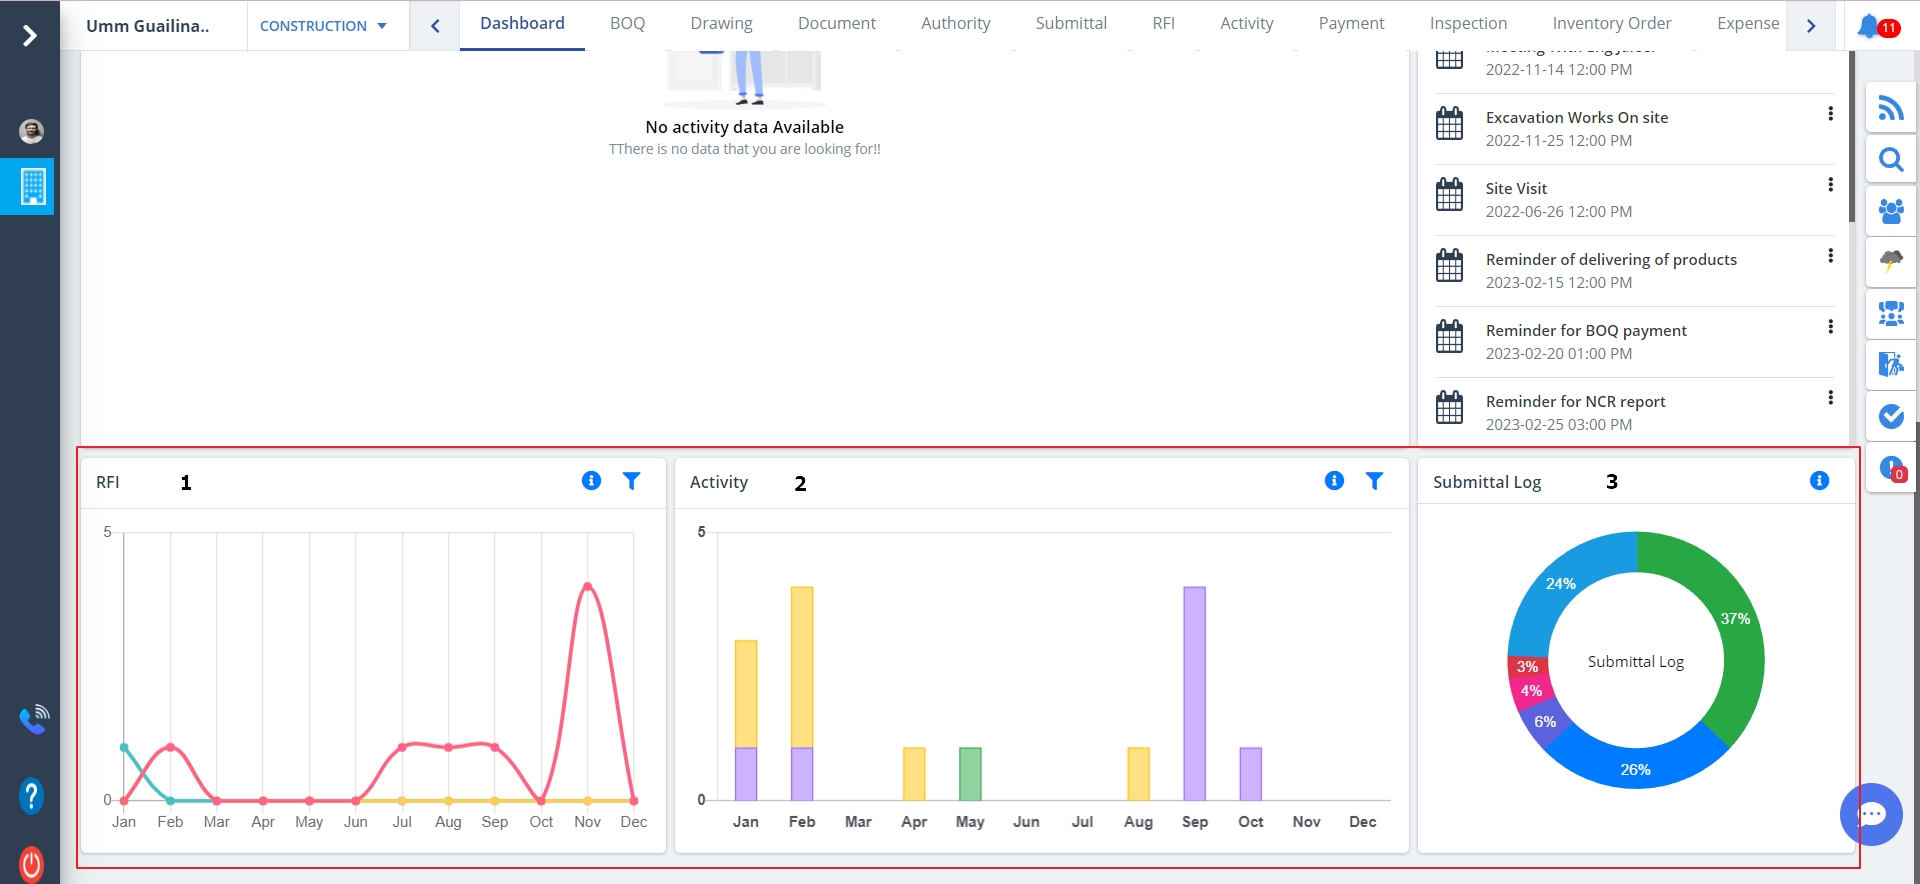
- RFI (Request For Information) representation using a Graph
- A Bar diagram for the tasks
- A donut diagram for submittal log all based on status (In progress, completed, open)
- The Exclamation (!) can be used to view the status and its count.
- Use the filters provided to view the data as per your desire.
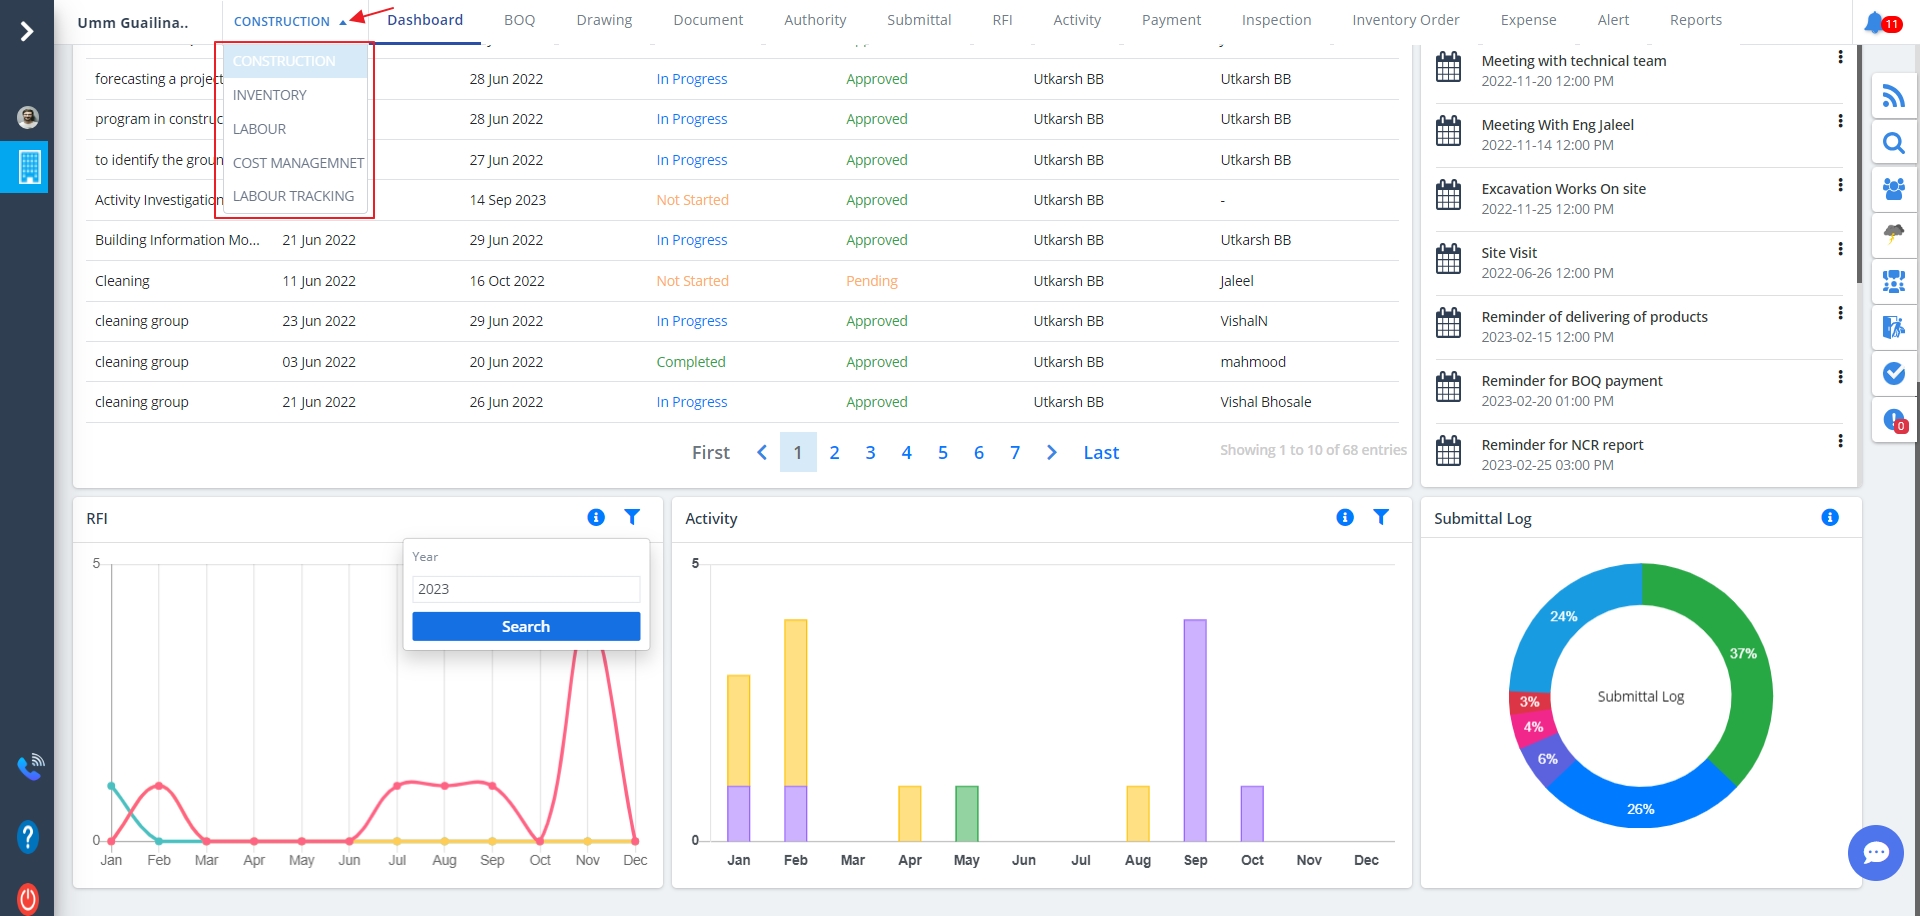
- You can switch the service from the menu.
- Just select the dropdown and choose the appropriate service.
- Use the “<” view the previous menus, “>” to view the next menus, only applicable when we have a vast menu list.
Project Status
What is a Project Status?
Project statuses are measurements that can tell professionals about the progress they make
on a particular project. Professionals often display project statuses on reports and
organizational documents that they reference as they complete the various stages of a project.
View Timeline
This category includes:-
My Reminder
Data Representation
Data Representation includes:-
